GameStop 2014 Annual Report Download - page 59
Download and view the complete annual report
Please find page 59 of the 2014 GameStop annual report below. You can navigate through the pages in the report by either clicking on the pages listed below, or by using the keyword search tool below to find specific information within the annual report.-
 1
1 -
2
-
3
-
4
-
5
-
6
-
7
-
8
-
9
-
10
-
11
-
12
-
13
-
14
-
15
-
16
-
17
-
18
-
19
-
20
-
21
-
22
-
23
-
24
-
25
-
26
-
27
-
28
-
29
-
30
-
31
-
32
-
33
-
34
-
35
-
36
-
37
-
38
-
39
-
40
-
41
-
42
-
43
-
44
-
45
-
46
-
47
-
48
-
 49
49 -
 50
50 -
 51
51 -
 52
52 -
 53
53 -
 54
54 -
 55
55 -
 56
56 -
 57
57 -
 58
58 -
 59
59 -
 60
60 -
 61
61 -
 62
62 -
 63
63 -
 64
64 -
 65
65 -
 66
66 -
 67
67 -
 68
68 -
 69
69 -
70
-
71
-
72
-
73
-
74
-
75
-
76
-
77
-
78
-
79
-
80
-
81
-
82
-
83
-
84
-
85
-
86
-
87
-
88
-
89
-
90
-
91
-
92
-
93
-
94
-
95
-
96
-
97
-
98
-
99
-
100
-
101
-
102
-
103
-
104
-
105
-
106
-
107
-
108
-
109
-
110
-
111
-
112
-
113
-
114
 |
 |

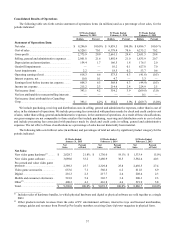
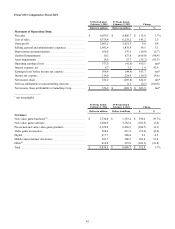
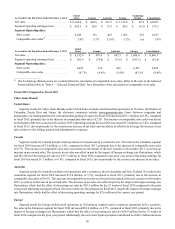
The increases described above were partially offset by the following:
•New video game software sales decreased $391.9 million, or 11.3%, for fiscal 2014 as compared to fiscal 2013, primarily
due to adecline in prior generation software sales and aweaker lineup of new titles released during fiscal 2014 as compared
to fiscal 2013. We expect the decline in prior generation software sales to continueinthe near term.
•Sales of other product categories decreased $16.5 million, or 4.0%, for fiscal 2014 as compared to fiscal 2013, primarily
due to adecrease in Game Informer physical subscriptions as aresultofthe shift to digital subscriptions, which are
reflected in the digital product category,lower sales of strategy guides and fewer new titles of PC entertainment software
released during the current year period. These decreases were partially offset by an increase in the sale of interactive toys
during fiscal 2014 as compared to fiscal 2013.
As apercentage of net sales, there was ashift in sales mix from new video game software to new video game hardware during
the majority of fiscal 2014 compared to fiscal 2013 due to the release of the next-generation consoles in November 2013 and the
decline in software sales in fiscal 2014.
Cost of Sales
Cost of sales increased $141.7 million, or 2.2%, in fiscal 2014 compared to fiscal 2013, primarily as aresultofthe increase
in net sales discussed above and the changesingross profit discussed below.
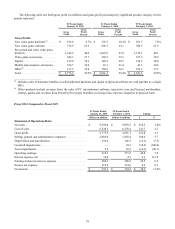
Gross Profit
Gross profit increased $114.8 million, or 4.3%, in fiscal 2014 compared to fiscal 2013, and gross profit as apercentage of net
sales was 29.9% in fiscal 2014 compared to 29.4% in fiscal 2013. The gross profit increase was primarily driven by the growth
in the mobile and consumer electronics category related to our Technology Brands segment, which increased gross profit by $151.5
million year-over-year.
The net increase in gross profit as apercentage of net sales was due to the following:
•Gross profit as apercentage of sales on pre-owned and value video game products increased to 48.0% in fiscal 2014 from
47.0% in fiscal 2013 due to higher promotional activity in the prior year,aswell as the increase in gross profit percentage
that occurs as prior generation video game platforms mature.
•Gross profit as apercentage of sales on digital sales increased to 70.3% in fiscal 2014 from 68.5% in fiscal 2013 due to
the growth of Kongregate, our platform for web and mobile gaming, as well as the conversion of certain digital revenue
streamsfromafull retail price revenue arrangement to commission revenue, which has the effect of decreasing sales
with no impact on gross profit.
•Gross profit as apercentage of sales on mobile and consumer electronics revenues increased to 36.0% in fiscal 2014 from
21.4% in fiscal 2013 due to the acquisition and opening of new stores within the Technology Brands segment.
The increases described above were partially offset by the following:
•Gross profit as apercentage of sales on new video game hardware decreased to 9.7% in fiscal 2014 from 10.2% in fiscal
2013. The gross profit percentage decrease was driven by the mix of next generation console sales, which carry lower
margins compared to the prior generation.
•Gross profit as apercentage of sales on video game accessories decreased to 37.7% in fiscal 2014 from 39.3% in fiscal
2013, due to the mix of next generation accessories sales, which carry lower gross margins relative to the total video
game accessories category.
•Gross profit as apercentage of sales on other product categories decreased to 32.8% in fiscal 2014 from 36.1% in fiscal
2013, due to adecrease in Game Informer physical subscriptions as aresult of the shift to digital subscriptions, which
are reflected in the digital product category.
Selling, General and Administrative Expenses
Selling, general and administrative expenses increased $108.6 million, or 5.7%, in fiscal 2014 compared to fiscal 2013. The
increase was primarily due to the growth of the Technology Brands segment, which carries higher selling, general and administrative
expenses as apercentage of sales than the other segments. Technology Brands contributed $111.5 million to the increase for fiscal
2014 compared to fiscal 2013. This increase was offset in part by the impact of foreign exchange rate fluctuations, which had the
effect of decreasing selling, general and administrative expenses by $24.3 million for the 52 weeks of fiscal 2014 compared to
the prior year period. Included in selling, general and administrative expenses are $21.5 million and $19.4 million in stock-based
compensation expense for fiscal 2014 and fiscal 2013, respectively.
40