GameStop 2014 Annual Report Download - page 66
Download and view the complete annual report
Please find page 66 of the 2014 GameStop annual report below. You can navigate through the pages in the report by either clicking on the pages listed below, or by using the keyword search tool below to find specific information within the annual report.-
 1
1 -
2
-
3
-
4
-
5
-
6
-
7
-
8
-
9
-
10
-
11
-
12
-
13
-
14
-
15
-
16
-
17
-
18
-
19
-
20
-
21
-
22
-
23
-
24
-
25
-
26
-
27
-
28
-
29
-
30
-
31
-
32
-
33
-
34
-
35
-
36
-
37
-
38
-
39
-
40
-
41
-
42
-
43
-
44
-
45
-
46
-
47
-
48
-
49
-
50
-
51
-
52
-
53
-
54
-
55
-
 56
56 -
 57
57 -
 58
58 -
 59
59 -
 60
60 -
 61
61 -
 62
62 -
 63
63 -
 64
64 -
 65
65 -
 66
66 -
 67
67 -
 68
68 -
 69
69 -
 70
70 -
 71
71 -
 72
72 -
 73
73 -
 74
74 -
 75
75 -
 76
76 -
77
-
78
-
79
-
80
-
81
-
82
-
83
-
84
-
85
-
86
-
87
-
88
-
89
-
90
-
91
-
92
-
93
-
94
-
95
-
96
-
97
-
98
-
99
-
100
-
101
-
102
-
103
-
104
-
105
-
106
-
107
-
108
-
109
-
110
-
111
-
112
-
113
-
114
 |
 |

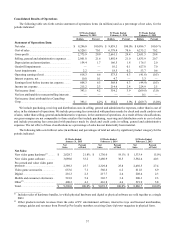
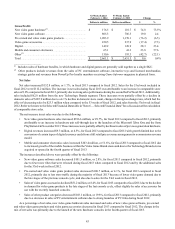
in net sales year-over-year.These decreaseswere offset in part by an increase in comparable store sales of 2.3%. Operating
earnings for fiscal 2014 decreased $8.4 million, or 19.0%, compared to fiscal 2013, driven primarily by the pre-tax loss of $14.8
million in fiscal 2014 related to the exit of our Spain operations, as well as the impact of foreignexchangeratefluctuations, which
had the effect of decreasing operating earnings by $5.2 million in the current year period.
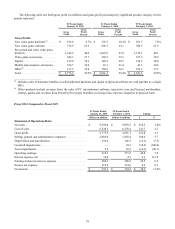
Technology Brands
Segment results for the Technology Brands segment include our Spring Mobile managed AT &T and Cricket Wireless branded
stores and our Simply Mac business. For fiscal 2014, Technology Brands net sales were $328.6 million, with operating earnings
of $32.9 million. For fiscal 2013, Technology Brands net sales were $62.8 million, with an operating loss of $0.2 million. The
increase in net sales and operating earnings from fiscal 2013 to fiscal 2014 was attributable to our continued investment and growth
in our Technology Brands businesses.
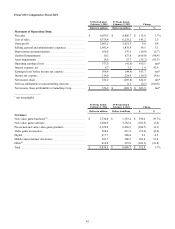
Fiscal 2013 Compared to Fiscal 2012
Video Game Brands
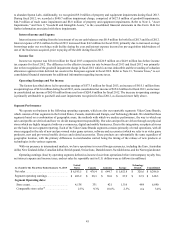
United States
Segment results for the United States VideoGame Brands segment include retail operations in 50 states, the District of
Columbia, Puerto Rico and Guam, the electronic commerce website www.gamestop.com, Game Informer magazine and
Kongregate, our leading platform for web and mobile gaming.
Although net sales for fiscal 2013 decreased 0.5% compared to fiscal 2012, comparable store sales increased 3.0%. The
decrease in net sales was primarily due to a$185.9million decline in sales due to a4.1%decrease in domestic store count and
sales for the 53rd week in fiscal 2012. The increase in comparable store sales was primarily due to strong performance of new
video game console and title releases during the second half of the year,which more than offset the declines that had been
experienced during the first half of fiscal 2013.
Asset impairments of $24.0 million were recognized in fiscal 2013 primarily related to our decision to abandon our Spawn
Labs business. Asset impairments of $5.7 million were recognized in fiscal 2012 primarily related to impairment of finite-lived
assets. Segment operating income for fiscal 2013 was $465.3 million compared to $501.9 million in fiscal 2012, primarily related
to the asset impairments described above, the impact of adecline in sales prior to the launch of the next generation consoles and
the impact of lower margin console sales as apercentage of total sales, as well as the impact of the operating earnings in the 53rd
week in fiscal 2012.
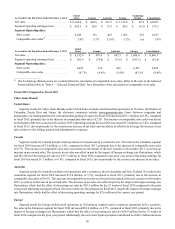
Canada
Segment results for Canada include retail operations in Canada and an e-commerce site. Net sales in the Canadian segment
in the 52 weeks ended February 1, 2014 decreased 2.0% compared to the 53 weeks ended February 2, 2013 .The decrease in net
saleswas primarily attributable to changes in exchange rates of $22.3 million for fiscal 2013 and additional sales in the 53rd week
of fiscal 2012 when compared to fiscal 2013, partially offset by an increase in sales at existing stores of 5.7%. The increase in net
salesatexisting stores was primarily due to the launch of the next generation consoles.
The segment operating profit for fiscal 2013 was $26.6 million compared to an operating loss of $74.4 million for fiscal 2012.
The increase in operating earnings was primarily due to the goodwill and asset impairment charges of $100.7 million recognized
during fiscal 2012 and adecrease in selling, general and administrative expensesasaresult of lower sales and lower store count
when compared to fiscal 2012, partially offset by exchange rate fluctuations, which had the impact of decreasing operating earnings
by $1.4 million in fiscal 2013.
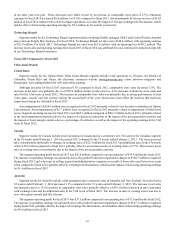
Australia
Segment results for Australia include retail operations and e-commerce sites in Australia and New Zealand. Net sales for the
52 weeks ended February 1, 2014 increased 1.1% compared to the 53 weeks ended February 2, 2013. The increase in net sales
was primarily due to a12.6% increase in comparable store sales, partially offset by a$58.1 million reduction in sales associated
with exchange rates and the additional sales in the 53rd week of fiscal 2012. The increase in sales at existing stores was due to
new video gameconsoleand titlereleases.
The segment operating profit for fiscal 2013 was $37.5 million compared to an operating loss of $71.6 million for fiscal 2012.
The increase in operating earnings was primarily due to the goodwill and asset impairment charges of $107.3 million recognized
during fiscal 2012, partially offset by the impact of exchange rate fluctuations, which had the effect of decreasing operating earnings
by $4.8 million in fiscal 2013.
47