GameStop 2014 Annual Report Download - page 50
Download and view the complete annual report
Please find page 50 of the 2014 GameStop annual report below. You can navigate through the pages in the report by either clicking on the pages listed below, or by using the keyword search tool below to find specific information within the annual report.-
 1
1 -
2
-
3
-
4
-
5
-
6
-
7
-
8
-
9
-
10
-
11
-
12
-
13
-
14
-
15
-
16
-
17
-
18
-
19
-
20
-
21
-
22
-
23
-
24
-
25
-
26
-
27
-
28
-
29
-
30
-
31
-
32
-
33
-
34
-
35
-
36
-
37
-
38
-
39
-
 40
40 -
 41
41 -
 42
42 -
 43
43 -
 44
44 -
 45
45 -
 46
46 -
 47
47 -
 48
48 -
 49
49 -
 50
50 -
 51
51 -
 52
52 -
 53
53 -
 54
54 -
 55
55 -
 56
56 -
 57
57 -
 58
58 -
 59
59 -
 60
60 -
61
-
62
-
63
-
64
-
65
-
66
-
67
-
68
-
69
-
70
-
71
-
72
-
73
-
74
-
75
-
76
-
77
-
78
-
79
-
80
-
81
-
82
-
83
-
84
-
85
-
86
-
87
-
88
-
89
-
90
-
91
-
92
-
93
-
94
-
95
-
96
-
97
-
98
-
99
-
100
-
101
-
102
-
103
-
104
-
105
-
106
-
107
-
108
-
109
-
110
-
111
-
112
-
113
-
114
 |
 |

___________________
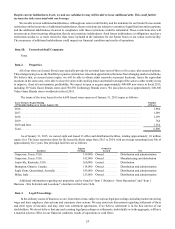
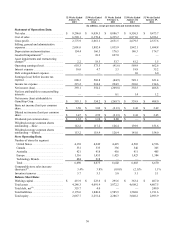
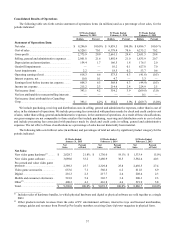
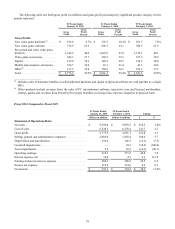
(1) Results for fiscal 2013 include agoodwill impairment charge of $10.2 million related to our decision to abandon our
investment in Spawn Labs. Results for fiscal 2012 include charges related to goodwill impairments of $627.0 million
resulting from our interim goodwill impairment tests performed during the third quarter of fiscal 2012. See Note 9, "Goodwill
and Intangible Assets," to our consolidated financial statements for further information regarding our goodwill impairment
charges.
(2) Results for fiscal 2014 include impairment charges of $2.2 million, comprised of $1.9 million of property and equipment
impairments and $0.3 million of intangible asset impairments. Results for fiscal 2013 include impairments of $18.5 million,
of which $7.4 million and $2.1 million were related to certain technology assets and other intangible assets, respectively,
as aresultofour decision to abandon our investment in Spawn Labs and the remaining $9.0 million was related to property
and equipment impairments resulting from our evaluation of store property,equipment and other assets. Results for fiscal
2012 include charges related to asset impairments of $53.7 million, of which $44.9 million relates to the impairment of
the Micromania trade name and $8.8 million relates to other impairment charges from the evaluations of store property,
equipment and other assets. Results for fiscal 2011include charges related to asset impairments and restructuring charges
of $81.2 million, of which $37.8 million relates to the impairment of the Micromania trade name, $22.7 million relates to
the impairment of investments in non-core businesses and $20.7 million relates to other impairments, termination benefits
and facility closure costs. Results for fiscal 2010 include impairment charges resulting from our evaluation of store property,
equipment and other assets.
(3) Comparable store sales is ameasure commonly used in the retail industry and indicates store performance by measuring
the growth in sales for certain stores for aparticular period over the corresponding period in the prior year.Our comparable
storesales are comprised of sales from our VideoGame Brands stores operating for at least 12 full months as well as sales
related to our websites and sales we earn from sales of pre-owned merchandise to wholesalers or dealers. Comparable
storesales for our international operating segments exclude the effect of changes in foreign currency exchange rates. The
calculation of comparable store sales for the 52 weeks ended January 31, 2015 compares the 52 weeks for the period ended
January31, 2015 to themostclosely comparable weeks for the prior year period. The method of calculating comparable
storesales varies across the retail industry.Asaresult, our method of calculating comparable store sales may not be the
same as otherretailers’ methods. Our Technology Brands stores are excluded from the calculation of comparable store
sales.Wedonot consider comparable store sales to be ameaningfulmetric in evaluating the performance of our Technology
Brands stores due to the frequently changing nature of revenue streams and commission structures associated with this
segmentofour business. We believe our calculation of comparable store sales best represents our strategy as amulti-
channel retailer who provides its consumers several ways to access its products.
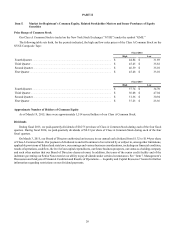
(4) On September 24, 2014, we issued $350.0 million aggregate principal amount of unsecured 5.50% senior notes due October
1, 2019 (the "Senior Notes"). The Senior Notes bear interest at the rate of 5.50% per annum with interest payable semi-
annually in arrears on April 1and October 1ofeach year beginning on April 1, 2015. The Senior Notes were sold in a
private placement and will not be registered under the U.S. Securities Act of 1933. The Senior Notes were offered in the
U.S. to “qualified institutional buyers” pursuant to the exemption from registration under Rule 144A of the Securities Act
and in exempted offshore transactions pursuant to Regulation Sunder the Securities Act. See Note 10, "Debt," to our
consolidated financial statements for additional informationregarding the Senior Notes.
31