GameStop 2014 Annual Report Download - page 60
Download and view the complete annual report
Please find page 60 of the 2014 GameStop annual report below. You can navigate through the pages in the report by either clicking on the pages listed below, or by using the keyword search tool below to find specific information within the annual report.-
 1
1 -
2
-
3
-
4
-
5
-
6
-
7
-
8
-
9
-
10
-
11
-
12
-
13
-
14
-
15
-
16
-
17
-
18
-
19
-
20
-
21
-
22
-
23
-
24
-
25
-
26
-
27
-
28
-
29
-
30
-
31
-
32
-
33
-
34
-
35
-
36
-
37
-
38
-
39
-
40
-
41
-
42
-
43
-
44
-
45
-
46
-
47
-
48
-
49
-
 50
50 -
 51
51 -
 52
52 -
 53
53 -
 54
54 -
 55
55 -
 56
56 -
 57
57 -
 58
58 -
 59
59 -
 60
60 -
 61
61 -
 62
62 -
 63
63 -
 64
64 -
 65
65 -
 66
66 -
 67
67 -
 68
68 -
 69
69 -
 70
70 -
71
-
72
-
73
-
74
-
75
-
76
-
77
-
78
-
79
-
80
-
81
-
82
-
83
-
84
-
85
-
86
-
87
-
88
-
89
-
90
-
91
-
92
-
93
-
94
-
95
-
96
-
97
-
98
-
99
-
100
-
101
-
102
-
103
-
104
-
105
-
106
-
107
-
108
-
109
-
110
-
111
-
112
-
113
-
114
 |
 |

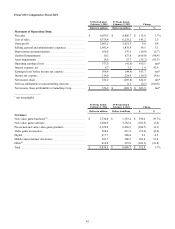
Depreciation and Amortization
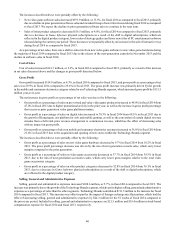
Depreciation and amortization expense decreased $12.1 million, or 7.3%, in fiscal 2014 compared to fiscal 2013. This decrease
was primarily due to adecrease in capitalinitiatives associated with our VideoGameBrandssegments.
Asset Impairments
During fiscal 2014, we recorded a$2.2million impairment, comprised of $1.9 million of property and equipment impairments
and $0.3 million of intangible asset impairments. During fiscal 2013, we recorded a$28.7 million impairment, comprised of a
$10.2 million goodwill impairment, a$7.4million impairment of technology assets, an impairment of $2.1 million of intangible
assets as aresultofour decision to abandon Spawn Labs and an impairment of $9.0 million of property and equipment. Refer to
Note 2, "Asset Impairments," and Note 9, "Goodwill and Intangible Assets," to the consolidated financial statements in this Form
10-K for further information associated with these impairments.
Interest Income and Expense
Interest income of $0.7 million for fiscal 2014, resulting from the investment of excess cash balances, decreased $0.2 million
from $0.9 million in fiscal 2013. Interest expense of $10.7 million for fiscal 2014 increased $5.1 million from $5.6 million in
fiscal 2013 primarily due to higher borrowings, including the $350.0 million issuance of Senior Notes in September 2014, which
is discussed more fully in Note10, "Debt," to our consolidated financial statements.
Income Tax
Income tax expense was $215.2 million, representing an effective tax rate of 35.4% in fiscal 2014, compared to $214.6 million,
representing an effective tax rate of 37.7% in fiscal 2013. The difference in the effective income tax rate between fiscal 2014 and
fiscal 2013 was primarily due to the recognition of tax benefits related to losses in subsidiary investments in fiscal 2014 for which
no benefit had previously been recorded. These benefits were partially offset by the recording of valuation allowances against (1)
certain deferred tax assets in the European segment and (2) credits in the United States segment. Without the effect of the tax loss
benefits and the recording of the valuation allowances, the effective income tax rate in fiscal 2014 would have been 36.7%. Refer
to Note 13, "IncomeTaxes," to our consolidated financial statements for additional informationregarding income taxes.
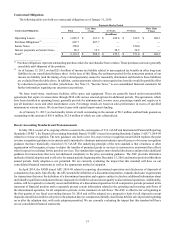
Operating Earnings and Net Income
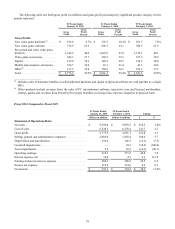
The factors described above led to operating earnings of $618.3 million for fiscal 2014, or a7.8%increase from operating
earnings of $573.5 million for fiscal 2013. Additionally,net income was $393.1 million for fiscal 2014, which represented an
11.0% increase from net income of $354.2 million for fiscal 2013. The increase in operating earnings isprimarilyattributable to
the growth of our Technology Brands segment, which contributed operating earnings growth of $33.1 million in fiscal 2014
compared to fiscal 2013. Operating earnings in the VideoGame Brands segments increased due to the launch of the new consoles,
which has driven year-over-year growth in our new video game hardware and video game accessories, as well as continued growth
in our pre-owned and value category.
41