GameStop 2014 Annual Report Download - page 58
Download and view the complete annual report
Please find page 58 of the 2014 GameStop annual report below. You can navigate through the pages in the report by either clicking on the pages listed below, or by using the keyword search tool below to find specific information within the annual report.-
 1
1 -
2
-
3
-
4
-
5
-
6
-
7
-
8
-
9
-
10
-
11
-
12
-
13
-
14
-
15
-
16
-
17
-
18
-
19
-
20
-
21
-
22
-
23
-
24
-
25
-
26
-
27
-
28
-
29
-
30
-
31
-
32
-
33
-
34
-
35
-
36
-
37
-
38
-
39
-
40
-
41
-
42
-
43
-
44
-
45
-
46
-
47
-
 48
48 -
 49
49 -
 50
50 -
 51
51 -
 52
52 -
 53
53 -
 54
54 -
 55
55 -
 56
56 -
 57
57 -
 58
58 -
 59
59 -
 60
60 -
 61
61 -
 62
62 -
 63
63 -
 64
64 -
 65
65 -
 66
66 -
 67
67 -
 68
68 -
69
-
70
-
71
-
72
-
73
-
74
-
75
-
76
-
77
-
78
-
79
-
80
-
81
-
82
-
83
-
84
-
85
-
86
-
87
-
88
-
89
-
90
-
91
-
92
-
93
-
94
-
95
-
96
-
97
-
98
-
99
-
100
-
101
-
102
-
103
-
104
-
105
-
106
-
107
-
108
-
109
-
110
-
111
-
112
-
113
-
114
 |
 |

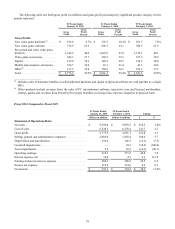
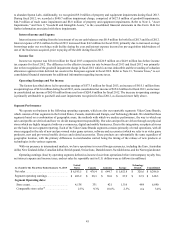
52 Weeks Ended
January 31, 2015
52 Weeks Ended
February 1, 2014 Change
Dollars in millions Dollars in millions $%
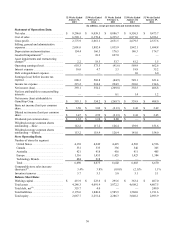
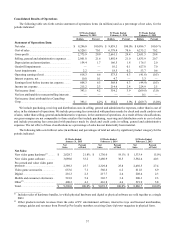
Net Sales:
New video game hardware(1)..................................................... $2,028.7 $1,730.0 $298.7 17.3%
New video game software......................................................... 3,089.03,480.9 (391.9) (11.3)
Pre-owned and value video game products............................... 2,389.32,329.8 59.5 2.6
Video game accessories............................................................. 653.6560.6 93.0 16.6
Digital........................................................................................ 216.3217.7 (1.4)(0.6)
Mobile and consumer electronics ............................................. 518.8303.7 215.170.8
Other(2)....................................................................................... 400.3416.8 (16.5) (4.0)
Total........................................................................................... $9,296.0 $9,039.5 $256.5 2.8%
52 Weeks Ended
January 31, 2015
52 Weeks Ended
February 1, 2014 Change
Dollars in millions Dollars in millions $%
Gross Profit:
New video game hardware(1)..................................................... $196.6 $176.5 $20.111.4%
New video game software......................................................... 716.9805.3 (88.4) (11.0)
Pre-owned and valuevideo game products............................... 1,146.31,093.9 52.4 4.8
Video game accessories............................................................. 246.1220.5 25.6 11.6
Digital........................................................................................ 152.0149.2 2.81.9
Mobile and consumerelectronics ............................................. 186.765.1121.6 186.8
Other(2)....................................................................................... 131.3150.6 (19.3) (12.8)
Total........................................................................................... $2,775.9 $2,661.1 $114.8 4.3%
___________________
(1) Includes sales of hardware bundles, in which physical hardware and digital or physical software are sold together as asingle
SKU.
(2) Other products include revenues from the sales of PC entertainment software, interactive toys and licensed merchandise,
strategy guides and revenues from PowerUp Pro loyalty members receiving Game Informer magazine in physical form.
Net Sales
Net sales increased $256.5 million, or 2.8%, in fiscal 2014 compared to fiscal 2013. The increase in net sales during fiscal
2014 was primarily attributable to an increase in comparable store sales of 3.4% compared to fiscal 2013, due to strong sales
performance in the current year period associated with the new video game console launches and related video game accessories,
as well as the continued growth of the Technology Brands segment. These increases were partially offset by the impact of foreign
exchange rate fluctuations, which had the effect of decreasing net sales by $133.9 million for the 52 weeks of fiscal 2014 compared
to the prior year period. Refer to the note to the Selected Financial Data table in "Item 6—Selected Financial Data" for adiscussion
of the calculation of comparable store sales.
The net increase in net sales was due to the following:
•New video game hardware sales increased $298.7 million, or 17.3%, for fiscal 2014 as compared to fiscal 2013, primarily
attributable to an increase in hardware unit sell-through due to the launches of the Microsoft Xbox One and the Sony
PlayStation 4inNovember2013. This increase was partially offset by declines in sales of previous generation hardware.
•Pre-owned and value video game product sales increased $59.5 million, or 2.6%, for fiscal 2014 as compared to fiscal
2013, primarily due to trade growth and an increase in pre-owned hardware sales resulting from the release of Microsoft
Xbox One and the Sony PlayStation 4inNovember2013.
•Video game accessories sales increased $93.0 million, or 16.6%, for fiscal 2014 as compared to fiscal 2013, due to sales
of accessories for use with the recently launched consoles.
•Mobile and consumer electronics sales increased $215.1 million, or 70.8%, for fiscal 2014 as compared to fiscal 2013,
due to the acquisitions of stores within the Technology Brands segment. Sales related to the Technology Brands segment
increased $265.8 million for fiscal 2014 compared to the prior year period.
39