Cisco 2011 Annual Report Download - page 89
Download and view the complete annual report
Please find page 89 of the 2011 Cisco annual report below. You can navigate through the pages in the report by either clicking on the pages listed below, or by using the keyword search tool below to find specific information within the annual report.-
 1
1 -
2
-
3
-
4
-
5
-
6
-
7
-
8
-
9
-
10
-
11
-
12
-
13
-
14
-
15
-
16
-
17
-
18
-
19
-
20
-
21
-
22
-
23
-
24
-
25
-
26
-
27
-
28
-
29
-
30
-
31
-
32
-
33
-
34
-
35
-
36
-
37
-
38
-
39
-
40
-
41
-
42
-
43
-
44
-
45
-
46
-
47
-
48
-
49
-
50
-
51
-
52
-
53
-
54
-
55
-
56
-
57
-
58
-
59
-
60
-
61
-
62
-
63
-
64
-
65
-
66
-
67
-
68
-
69
-
70
-
71
-
72
-
73
-
74
-
75
-
76
-
77
-
78
-
 79
79 -
 80
80 -
 81
81 -
 82
82 -
 83
83 -
 84
84 -
 85
85 -
 86
86 -
 87
87 -
 88
88 -
 89
89 -
 90
90 -
 91
91 -
 92
92 -
 93
93 -
 94
94 -
 95
95 -
 96
96 -
 97
97 -
 98
98 -
 99
99 -
100
-
101
-
102
-
103
-
104
-
105
-
106
-
107
-
108
-
109
-
110
-
111
-
112
-
113
-
114
-
115
-
116
-
117
-
118
-
119
-
120
-
121
-
122
-
123
-
124
-
125
-
126
-
127
-
128
-
129
-
130
-
131
-
132
-
133
-
134
-
135
-
136
-
137
-
138
-
139
-
140
-
141
-
142
-
143
-
144
-
145
-
146
-
147
-
148
-
149
-
150
-
151
-
152
 |
 |

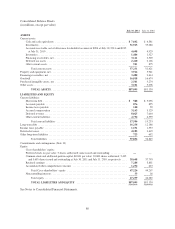
Consolidated Statements of Operations
(in millions, except per-share amounts)
Years Ended July 30, 2011 July 31, 2010 July 25, 2009
NET SALES:
Product ................................................ $34,526 $32,420 $29,131
Service ................................................ 8,692 7,620 6,986
Total net sales ....................................... 43,218 40,040 36,117
COST OF SALES:
Product ................................................ 13,647 11,620 10,481
Service ................................................ 3,035 2,777 2,542
Total cost of sales .................................... 16,682 14,397 13,023
GROSS MARGIN ........................................... 26,536 25,643 23,094
OPERATING EXPENSES:
Research and development ................................. 5,823 5,273 5,208
Sales and marketing ...................................... 9,812 8,782 8,444
General and administrative ................................. 1,908 1,933 1,524
Amortization of purchased intangible assets ................... 520 491 533
In-process research and development ......................... ——63
Restructuring and other charges ............................. 799 ——
Total operating expenses .............................. 18,862 16,479 15,772
OPERATING INCOME ..................................... 7,674 9,164 7,322
Interest income .......................................... 641 635 845
Interest expense ......................................... (628) (623) (346)
Other income (loss), net ................................... 138 239 (128)
Interest and other income, net ........................... 151 251 371
INCOME BEFORE PROVISION FOR INCOME TAXES ......... 7,825 9,415 7,693
Provision for income taxes ..................................... 1,335 1,648 1,559
NET INCOME ......................................... $ 6,490 $ 7,767 $ 6,134
Net income per share—basic ................................... $ 1.17 $ 1.36 $ 1.05
Net income per share—diluted .................................. $ 1.17 $ 1.33 $ 1.05
Shares used in per-share calculation—basic ........................ 5,529 5,732 5,828
Shares used in per-share calculation—diluted ...................... 5,563 5,848 5,857
See Notes to Consolidated Financial Statements.
81