Cisco 2011 Annual Report Download - page 64
Download and view the complete annual report
Please find page 64 of the 2011 Cisco annual report below. You can navigate through the pages in the report by either clicking on the pages listed below, or by using the keyword search tool below to find specific information within the annual report.-
 1
1 -
2
-
3
-
4
-
5
-
6
-
7
-
8
-
9
-
10
-
11
-
12
-
13
-
14
-
15
-
16
-
17
-
18
-
19
-
20
-
21
-
22
-
23
-
24
-
25
-
26
-
27
-
28
-
29
-
30
-
31
-
32
-
33
-
34
-
35
-
36
-
37
-
38
-
39
-
40
-
41
-
42
-
43
-
44
-
45
-
46
-
47
-
48
-
49
-
50
-
51
-
52
-
53
-
 54
54 -
 55
55 -
 56
56 -
 57
57 -
 58
58 -
 59
59 -
 60
60 -
 61
61 -
 62
62 -
 63
63 -
 64
64 -
 65
65 -
 66
66 -
 67
67 -
 68
68 -
 69
69 -
 70
70 -
 71
71 -
 72
72 -
 73
73 -
 74
74 -
75
-
76
-
77
-
78
-
79
-
80
-
81
-
82
-
83
-
84
-
85
-
86
-
87
-
88
-
89
-
90
-
91
-
92
-
93
-
94
-
95
-
96
-
97
-
98
-
99
-
100
-
101
-
102
-
103
-
104
-
105
-
106
-
107
-
108
-
109
-
110
-
111
-
112
-
113
-
114
-
115
-
116
-
117
-
118
-
119
-
120
-
121
-
122
-
123
-
124
-
125
-
126
-
127
-
128
-
129
-
130
-
131
-
132
-
133
-
134
-
135
-
136
-
137
-
138
-
139
-
140
-
141
-
142
-
143
-
144
-
145
-
146
-
147
-
148
-
149
-
150
-
151
-
152
 |
 |

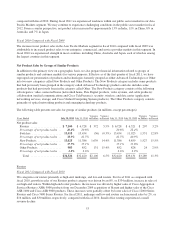
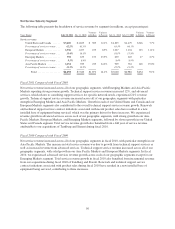
Net Service Sales by Segment
The following table presents the breakdown of service revenue by segment (in millions, except percentages):
Years Ended July 30, 2011 July 31, 2010
Variance
in Dollars
Variance
in Percent July 31, 2010 July 25, 2009
Variance
in Dollars
Variance
in Percent
Service revenue:
United States and Canada ...... $ 5,410 $ 4,825 $ 585 12.1% $ 4,825 $ 4,479 $346 7.7%
Percentage of service revenue ... 62.2% 63.3% 63.3% 64.1%
European Markets ............ 1,336 1,227 109 8.9% 1,227 1,104 123 11.1%
Percentage of service revenue ... 15.4% 16.1% 16.1% 15.8%
Emerging Markets ............ 792 639 153 23.9% 639 622 17 2.7%
Percentage of service revenue ... 9.1% 8.4% 8.4% 8.9%
Asia Pacific Markets .......... 1,154 929 225 24.2% 929 781 148 19.0%
Percentage of service revenue ... 13.3% 12.2% 12.2% 11.2%
Total ................. $8,692 $7,620 $1,072 14.1% $7,620 $6,986 $634 9.1%
Fiscal 2011 Compared with Fiscal 2010
Net service revenue increased across all of our geographic segments, with Emerging Markets and Asia Pacific
Markets reporting strong revenue growth. Technical support services revenue increased 12%, and advanced
services, which relates to consulting support services for specific network needs, experienced 21% revenue
growth. Technical support service revenue increased across all of our geographic segments with particular
strength in Emerging Markets and Asia Pacific Markets. Growth in each of our United States and Canada and our
European Markets segments also contributed to the overall technical support service revenue growth. Renewals
and technical support service contract initiations associated with recent product sales have resulted in a new
installed base of equipment being serviced, which was the primary driver for these increases. We experienced
revenue growth in advanced services across each of our geographic segments, with strong growth in our Asia
Pacific Markets, European Markets, and Emerging Markets segments, followed by slower growth in our United
States and Canada segment. Total service revenue growth also benefited from a full year of service revenue
attributable to our acquisitions of Tandberg and Starent during fiscal 2010.
Fiscal 2010 Compared with Fiscal 2009
Net service revenue increased across all of our geographic segments in fiscal 2010, with particular strength in our
Asia Pacific Markets. The increase in total service revenue was due to growth from technical support services as
well as increased revenue from advanced services. Technical support service revenue increased across all of our
geographic segments, with solid growth in our Asia Pacific Markets and European Markets segments. In fiscal
2010, we experienced advanced services revenue growth across each of our geographic segments except for our
Emerging Markets segment. Total service revenue growth in fiscal 2010 also benefited from incremental revenue
from our acquisitions during fiscal 2010 of Tandberg and Starent. Renewals and technical support service
contract initiations associated with product sales during fiscal 2010 have resulted in a new installed base of
equipment being serviced, contributing to these increases.
56