Cisco 2011 Annual Report Download - page 60
Download and view the complete annual report
Please find page 60 of the 2011 Cisco annual report below. You can navigate through the pages in the report by either clicking on the pages listed below, or by using the keyword search tool below to find specific information within the annual report.-
 1
1 -
2
-
3
-
4
-
5
-
6
-
7
-
8
-
9
-
10
-
11
-
12
-
13
-
14
-
15
-
16
-
17
-
18
-
19
-
20
-
21
-
22
-
23
-
24
-
25
-
26
-
27
-
28
-
29
-
30
-
31
-
32
-
33
-
34
-
35
-
36
-
37
-
38
-
39
-
40
-
41
-
42
-
43
-
44
-
45
-
46
-
47
-
48
-
49
-
 50
50 -
 51
51 -
 52
52 -
 53
53 -
 54
54 -
 55
55 -
 56
56 -
 57
57 -
 58
58 -
 59
59 -
 60
60 -
 61
61 -
 62
62 -
 63
63 -
 64
64 -
 65
65 -
 66
66 -
 67
67 -
 68
68 -
 69
69 -
 70
70 -
71
-
72
-
73
-
74
-
75
-
76
-
77
-
78
-
79
-
80
-
81
-
82
-
83
-
84
-
85
-
86
-
87
-
88
-
89
-
90
-
91
-
92
-
93
-
94
-
95
-
96
-
97
-
98
-
99
-
100
-
101
-
102
-
103
-
104
-
105
-
106
-
107
-
108
-
109
-
110
-
111
-
112
-
113
-
114
-
115
-
116
-
117
-
118
-
119
-
120
-
121
-
122
-
123
-
124
-
125
-
126
-
127
-
128
-
129
-
130
-
131
-
132
-
133
-
134
-
135
-
136
-
137
-
138
-
139
-
140
-
141
-
142
-
143
-
144
-
145
-
146
-
147
-
148
-
149
-
150
-
151
-
152
 |
 |

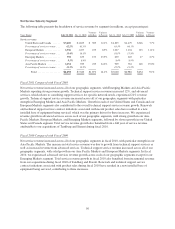
compared with fiscal 2009 was across all of our customer markets in the United States and Canada segment, led
by the commercial and enterprise markets. Within the enterprise market, net product sales to the U.S. federal
government increased as compared with fiscal 2009. Our net product sales in the consumer market for fiscal
2010 increased compared with fiscal 2009, primarily due to sales of Flip Video cameras from the acquisition of
Pure Digital, which we acquired in the fourth quarter of fiscal 2009. From a product perspective, the increase in
fiscal 2010 net product sales in this segment was driven in large part by higher sales of our switching products.
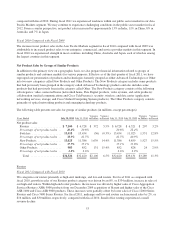
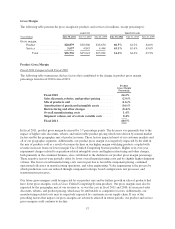
European Markets
Fiscal 2011 Compared with Fiscal 2010
For fiscal 2011, as compared with fiscal 2010, net product sales in the European Markets segment increased by
6%. The increase in net product sales in the European Markets segment was due to growth in the service provider
and enterprise markets. Sales to the commercial market were flat, while sales in the consumer market declined
for fiscal 2011, as compared with fiscal 2010. From a country perspective, for fiscal 2011 as compared with
fiscal 2010, net product sales increased by approximately 17% in France, 13% in the Netherlands, 2% in
Germany, 1% in the United Kingdom, and were flat in Italy.
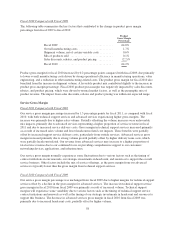
Fiscal 2010 Compared with Fiscal 2009
The slight increase in net product sales in the European Markets segment in fiscal 2010 compared with fiscal
2009 was driven by increased sales across most of our customer markets in this segment, with particular strength
in the enterprise and commercial markets. From a country perspective, net product sales increased in the United
Kingdom and France while decreasing for both Germany and Italy compared with fiscal 2009. Our European
Markets segment grew more slowly relative to other segments on a year-over-year basis, which we believe was
attributable in part to the fact that many of the countries in this segment were among the last countries to begin
experiencing the economic downturn in fiscal 2009, and consequently some of these countries are recovering
later. Product sales growth in this segment began to strengthen in the second half of fiscal 2010. During fiscal
2010 we did not see significant negative effects on our net product sales in the European Markets segment from
the economic and financial turmoil related to sovereign debt issues in certain European countries.
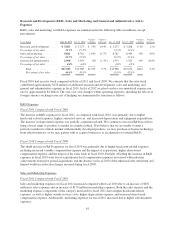
Emerging Markets
Fiscal 2011 Compared with Fiscal 2010
For fiscal 2011, as compared with fiscal 2010, net product sales in the Emerging Markets segment increased by
12%. The net product sales increase was led by a sales increase in the commercial market followed by sales
increases in the service provider and enterprise markets. Net product sales in the consumer market declined for
fiscal 2011, as compared with fiscal 2010. From a country perspective, net product sales increased by
approximately 63% in Russia, 20% in Brazil, and 8% in Mexico.
Fiscal 2010 Compared with Fiscal 2009
Net product sales in the Emerging Markets segment increased, primarily as a result of increased product sales
across all of our customer markets, with the exception of the consumer market. We experienced a return to
stronger year-over-year sales growth in the second half of fiscal 2010, led by Brazil, Mexico, and Russia.
Asia Pacific Markets
Fiscal 2011 Compared with Fiscal 2010
For fiscal 2011, as compared with fiscal 2010, net product sales in our Asia Pacific Markets segment increased
by 10%. The increase was led by sales growth in the commercial and enterprise markets and to a lesser extent
sales growth in the service provider market. Net product sales in the consumer market declined for fiscal 2011, as
52