Cisco 2011 Annual Report Download - page 69
Download and view the complete annual report
Please find page 69 of the 2011 Cisco annual report below. You can navigate through the pages in the report by either clicking on the pages listed below, or by using the keyword search tool below to find specific information within the annual report.-
 1
1 -
2
-
3
-
4
-
5
-
6
-
7
-
8
-
9
-
10
-
11
-
12
-
13
-
14
-
15
-
16
-
17
-
18
-
19
-
20
-
21
-
22
-
23
-
24
-
25
-
26
-
27
-
28
-
29
-
30
-
31
-
32
-
33
-
34
-
35
-
36
-
37
-
38
-
39
-
40
-
41
-
42
-
43
-
44
-
45
-
46
-
47
-
48
-
49
-
50
-
51
-
52
-
53
-
54
-
55
-
56
-
57
-
58
-
 59
59 -
 60
60 -
 61
61 -
 62
62 -
 63
63 -
 64
64 -
 65
65 -
 66
66 -
 67
67 -
 68
68 -
 69
69 -
 70
70 -
 71
71 -
 72
72 -
 73
73 -
 74
74 -
 75
75 -
 76
76 -
 77
77 -
 78
78 -
 79
79 -
80
-
81
-
82
-
83
-
84
-
85
-
86
-
87
-
88
-
89
-
90
-
91
-
92
-
93
-
94
-
95
-
96
-
97
-
98
-
99
-
100
-
101
-
102
-
103
-
104
-
105
-
106
-
107
-
108
-
109
-
110
-
111
-
112
-
113
-
114
-
115
-
116
-
117
-
118
-
119
-
120
-
121
-
122
-
123
-
124
-
125
-
126
-
127
-
128
-
129
-
130
-
131
-
132
-
133
-
134
-
135
-
136
-
137
-
138
-
139
-
140
-
141
-
142
-
143
-
144
-
145
-
146
-
147
-
148
-
149
-
150
-
151
-
152
 |
 |

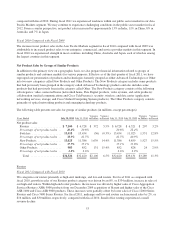
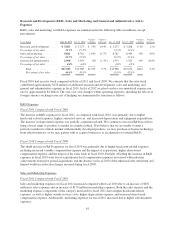
Research and Development (R&D), Sales and Marketing, and General and Administrative (G&A)
Expenses
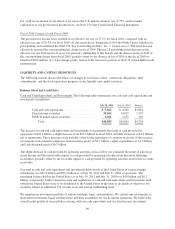
R&D, sales and marketing, and G&A expenses are summarized in the following table (in millions, except
percentages):
Years Ended July 30, 2011 July 31, 2010
Variance
in Dollars
Variance
in Percent July 31, 2010 July 25, 2009
Variance
in Dollars
Variance
in Percent
Research and development ...... $ 5,823 $ 5,273 $ 550 10.4% $ 5,273 $ 5,208 $ 65 1.2%
Percentage of net sales ......... 13.5% 13.2% 13.2% 14.4%
Sales and marketing ............ 9,812 8,782 1,030 11.7% 8,782 8,444 338 4.0%
Percentage of net sales ......... 22.7% 21.9% 21.9% 23.4%
General and administrative ...... 1,908 1,933 (25) (1.3%) 1,933 1,524 409 26.8%
Percentage of net sales ......... 4.4% 4.8% 4.8% 4.2%
Total .................... $17,543 $15,988 $1,555 9.7% $15,988 $15,176 $812 5.4%
Percentage of net sales ..... 40.6% 39.9% 39.9% 42.0%
Fiscal 2010 had an extra week compared with fiscal 2011 and fiscal 2009. We estimate that the extra week
contributed approximately $150 million of additional research and development, sales and marketing, and
general and administrative expense in fiscal 2010. In fiscal 2012 we plan to reduce our annualized expense run
rate by approximately $1 billion. The year-over-year changes within operating expenses, including the effects of
foreign currency exchange rates, net of hedging, are summarized by line item as follows:
R&D Expenses
Fiscal 2011 Compared with Fiscal 2010
The increase in R&D expenses for fiscal 2011, as compared with fiscal 2010, was primarily due to higher
headcount-related expenses, higher contracted services, and increased depreciation and equipment expenditures.
The increase in depreciation expense was partially acquisition related. We continue to invest in R&D in order to
bring a broad range of products to market in a timely fashion. If we believe that we are unable to enter a
particular market in a timely manner with internally developed products, we may purchase or license technology
from other businesses, or we may partner with or acquire businesses as an alternative to internal R&D.
Fiscal 2010 Compared with Fiscal 2009
The slight increase in R&D expenses for fiscal 2010 was primarily due to higher headcount-related expenses,
including increased variable compensation expense and the impact of acquisitions, higher share-based
compensation expense, and the impact of the extra week in fiscal 2010. Partially offsetting the increase in R&D
expenses in fiscal 2010 were lower acquisition-related compensation expenses associated with milestone
achievements from prior period acquisitions, and the absence in fiscal 2010 of the enhanced early retirement and
limited workforce reduction charges incurred during fiscal 2009.
Sales and Marketing Expenses
Fiscal 2011 Compared with Fiscal 2010
Sales and marketing expenses for fiscal 2011 increased compared with fiscal 2010 due to an increase of $851
million in sales expenses and an increase of $179 million in marketing expenses. Both the sales expense and the
marketing expense components of the category increased for fiscal 2011 due to higher headcount-related
expenses, as well as higher outside services costs, higher depreciation expense, and increased share-based
compensation expense. Additionally, marketing expenses for fiscal 2011 increased due to higher advertisement
expenses.
61