Cisco 2011 Annual Report Download - page 50
Download and view the complete annual report
Please find page 50 of the 2011 Cisco annual report below. You can navigate through the pages in the report by either clicking on the pages listed below, or by using the keyword search tool below to find specific information within the annual report.-
 1
1 -
2
-
3
-
4
-
5
-
6
-
7
-
8
-
9
-
10
-
11
-
12
-
13
-
14
-
15
-
16
-
17
-
18
-
19
-
20
-
21
-
22
-
23
-
24
-
25
-
26
-
27
-
28
-
29
-
30
-
31
-
32
-
33
-
34
-
35
-
36
-
37
-
38
-
39
-
 40
40 -
 41
41 -
 42
42 -
 43
43 -
 44
44 -
 45
45 -
 46
46 -
 47
47 -
 48
48 -
 49
49 -
 50
50 -
 51
51 -
 52
52 -
 53
53 -
 54
54 -
 55
55 -
 56
56 -
 57
57 -
 58
58 -
 59
59 -
 60
60 -
61
-
62
-
63
-
64
-
65
-
66
-
67
-
68
-
69
-
70
-
71
-
72
-
73
-
74
-
75
-
76
-
77
-
78
-
79
-
80
-
81
-
82
-
83
-
84
-
85
-
86
-
87
-
88
-
89
-
90
-
91
-
92
-
93
-
94
-
95
-
96
-
97
-
98
-
99
-
100
-
101
-
102
-
103
-
104
-
105
-
106
-
107
-
108
-
109
-
110
-
111
-
112
-
113
-
114
-
115
-
116
-
117
-
118
-
119
-
120
-
121
-
122
-
123
-
124
-
125
-
126
-
127
-
128
-
129
-
130
-
131
-
132
-
133
-
134
-
135
-
136
-
137
-
138
-
139
-
140
-
141
-
142
-
143
-
144
-
145
-
146
-
147
-
148
-
149
-
150
-
151
-
152
 |
 |
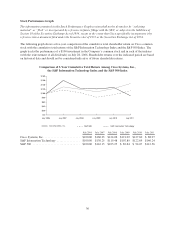
restructuring and other charges. Additionally, increased amortization expense and impairment charges from
purchased intangible assets contributed to the decline in product gross margin. Partially offsetting these decreases
were lower overall manufacturing costs and higher shipment volume. The increase in our service gross margin
was due to increased volume, partially offset by increased costs and unfavorable mix impacts. For further details
see our Discussion of Fiscal 2011, 2010 and 2009 beginning on page 50.
Operating Expenses
Total operating expenses in fiscal 2011, as compared with fiscal 2010, increased by 14%. In fiscal 2011, research
and development expenses increased 10%, sales and marketing expenses increased 12%, while general and
administrative expenses were down slightly. The collective increase was primarily a result of higher headcount-
related expenses. This increase was partially offset by the impact from the fiscal 2011 period containing one less
week compared with the fiscal 2010 period. Operating expense as a percentage of revenue increased by 2.4
percentage points, primarily as a result of restructuring and other charges and the higher headcount-related
charges along with increased expense from purchased intangible asset amortization and impairments.
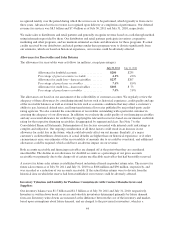
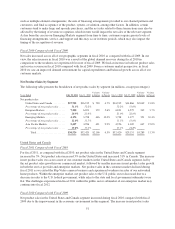
Other Key Financial Measures
The following is a summary of our other key financial measures for fiscal 2011:
• We generated cash flows from operations of $10.1 billion, compared with $10.2 billion in fiscal 2010.
Our cash and cash equivalents, together with our investments, were $44.6 billion at the end of fiscal
2011, compared with $39.9 billion at the end of fiscal 2010.
• Our total deferred revenue at the end of 2011 was $12.2 billion, compared with $11.1 billion at the end
of fiscal 2010.
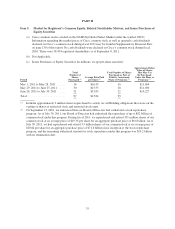
• We repurchased approximately 351 million shares of our common stock at an average price of $19.36
per share for an aggregate purchase price of $6.8 billion during fiscal 2011. As of the end of fiscal
2011, the remaining authorized repurchase amount under the stock repurchase program was $10.2
billion with no termination date. We also declared and paid dividends of $658 million to our
shareholders during fiscal 2011.
• Days sales outstanding in accounts receivable (DSO) at the end of fiscal 2011 was 38 days, compared
with 41 days at the end of fiscal 2010.
• Our inventory balance was $1.5 billion at the end of fiscal 2011, compared with $1.3 billion at the end
of fiscal 2010. Annualized inventory turns were 11.8 in the fourth quarter of fiscal 2011, compared
with 12.6 in the fourth quarter of fiscal 2010.
• Our product backlog at the end of fiscal 2011 was $4.3 billion, or 10% of fiscal 2011 net sales,
compared with $4.1 billion at the end of fiscal 2010, or 10% of fiscal 2010 net sales.
CRITICAL ACCOUNTING ESTIMATES
The preparation of financial statements and related disclosures in conformity with accounting principles
generally accepted in the United States requires us to make judgments, assumptions, and estimates that affect the
amounts reported in the Consolidated Financial Statements and accompanying notes. Note 2 to the Consolidated
Financial Statements describes the significant accounting policies and methods used in the preparation of the
Consolidated Financial Statements. The accounting policies described below are significantly affected by critical
accounting estimates. Such accounting policies require significant judgments, assumptions, and estimates used in
the preparation of the Consolidated Financial Statements, and actual results could differ materially from the
amounts reported based on these policies.
42