Cisco 2011 Annual Report Download - page 108
Download and view the complete annual report
Please find page 108 of the 2011 Cisco annual report below. You can navigate through the pages in the report by either clicking on the pages listed below, or by using the keyword search tool below to find specific information within the annual report.-
 1
1 -
2
-
3
-
4
-
5
-
6
-
7
-
8
-
9
-
10
-
11
-
12
-
13
-
14
-
15
-
16
-
17
-
18
-
19
-
20
-
21
-
22
-
23
-
24
-
25
-
26
-
27
-
28
-
29
-
30
-
31
-
32
-
33
-
34
-
35
-
36
-
37
-
38
-
39
-
40
-
41
-
42
-
43
-
44
-
45
-
46
-
47
-
48
-
49
-
50
-
51
-
52
-
53
-
54
-
55
-
56
-
57
-
58
-
59
-
60
-
61
-
62
-
63
-
64
-
65
-
66
-
67
-
68
-
69
-
70
-
71
-
72
-
73
-
74
-
75
-
76
-
77
-
78
-
79
-
80
-
81
-
82
-
83
-
84
-
85
-
86
-
87
-
88
-
89
-
90
-
91
-
92
-
93
-
94
-
95
-
96
-
97
-
 98
98 -
 99
99 -
 100
100 -
 101
101 -
 102
102 -
 103
103 -
 104
104 -
 105
105 -
 106
106 -
 107
107 -
 108
108 -
 109
109 -
 110
110 -
 111
111 -
 112
112 -
 113
113 -
 114
114 -
 115
115 -
 116
116 -
 117
117 -
 118
118 -
119
-
120
-
121
-
122
-
123
-
124
-
125
-
126
-
127
-
128
-
129
-
130
-
131
-
132
-
133
-
134
-
135
-
136
-
137
-
138
-
139
-
140
-
141
-
142
-
143
-
144
-
145
-
146
-
147
-
148
-
149
-
150
-
151
-
152
 |
 |

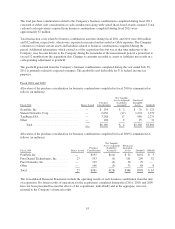
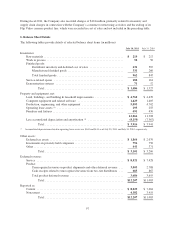
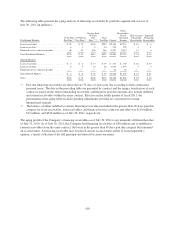
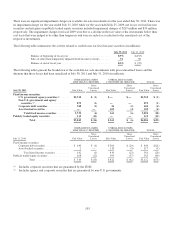
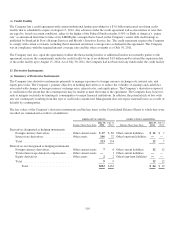
The following table presents the aging analysis of financing receivables by portfolio segment and class as of
July 30, 2011 (in millions):
Established Markets
31-60 Days
Past Due (1)
61-90 Days
Past Due (1)
Greater than
90 Days
Past
Due (1) (2)
Total
Past Due Current
Gross
Receivables,
Net of
Unearned
Income
Non-Accrual
Financing
Receivables
Impaired
Financing
Receivables
Lease receivables ..................... $ 85 $ 33 $139 $257 $2,454 $2,711 $ 16 $ 6
Loan receivables ...................... 6 1 9 16 379 395 1 1
Financed service contracts & other ....... 68 33 265 366 2,247 2,613 17 6
Total Established Markets .............. $159 $ 67 $413 $639 $5,080 $5,719 $ 34 $ 13
Growth Markets
Lease receivables ..................... $ 4 $ 2 $ 13 $ 19 $ 131 $ 150 $ 18 $ 18
Loan receivables ...................... 2 6 12 20 1,053 1,073 3 3
Financed service contracts & other ....... — — — — 24 24 — —
Total Growth Markets ................. $ 6 $ 8 $ 25 $ 39 $1,208 $1,247 $ 21 $ 21
Total ............................... $165 $ 75 $438 $678 $6,288 $6,966 $ 55 $ 34
(1) Past due financing receivables are those that are 31 days or more past due according to their contractual
payment terms. The data in the preceding table are presented by contract and the aging classification of each
contract is based on the oldest outstanding receivable, and therefore past due amounts also include unbilled
and current receivables within the same contract. Effective in the fourth quarter of fiscal 2011, the
presentation of the aging table excludes pending adjustments on billed tax assessment in certain
international markets.
(2) The balance of either unbilled or current financing receivables included in the greater-than-90 days past due
category for lease receivables, loan receivables, and financed service contracts and other was $116 million,
$15 million, and $230 million as of July 30, 2011, respectively.
The aging profile of the Company’s financing receivables as of July 30, 2011 is not materially different than that
of July 31, 2010. As of July 30, 2011, the Company had financing receivables of $50 million, net of unbilled or
current receivables from the same contract, that were in the greater than 90 days past due category but remained
on accrual status. A financing receivable may be placed on non-accrual status earlier if, in management’s
opinion, a timely collection of the full principal and interest becomes uncertain.
100