Cisco 2011 Annual Report Download - page 130
Download and view the complete annual report
Please find page 130 of the 2011 Cisco annual report below. You can navigate through the pages in the report by either clicking on the pages listed below, or by using the keyword search tool below to find specific information within the annual report.-
 1
1 -
2
-
3
-
4
-
5
-
6
-
7
-
8
-
9
-
10
-
11
-
12
-
13
-
14
-
15
-
16
-
17
-
18
-
19
-
20
-
21
-
22
-
23
-
24
-
25
-
26
-
27
-
28
-
29
-
30
-
31
-
32
-
33
-
34
-
35
-
36
-
37
-
38
-
39
-
40
-
41
-
42
-
43
-
44
-
45
-
46
-
47
-
48
-
49
-
50
-
51
-
52
-
53
-
54
-
55
-
56
-
57
-
58
-
59
-
60
-
61
-
62
-
63
-
64
-
65
-
66
-
67
-
68
-
69
-
70
-
71
-
72
-
73
-
74
-
75
-
76
-
77
-
78
-
79
-
80
-
81
-
82
-
83
-
84
-
85
-
86
-
87
-
88
-
89
-
90
-
91
-
92
-
93
-
94
-
95
-
96
-
97
-
98
-
99
-
100
-
101
-
102
-
103
-
104
-
105
-
106
-
107
-
108
-
109
-
110
-
111
-
112
-
113
-
114
-
115
-
116
-
117
-
118
-
119
-
 120
120 -
 121
121 -
 122
122 -
 123
123 -
 124
124 -
 125
125 -
 126
126 -
 127
127 -
 128
128 -
 129
129 -
 130
130 -
 131
131 -
 132
132 -
 133
133 -
 134
134 -
 135
135 -
 136
136 -
 137
137 -
 138
138 -
 139
139 -
 140
140 -
141
-
142
-
143
-
144
-
145
-
146
-
147
-
148
-
149
-
150
-
151
-
152
 |
 |

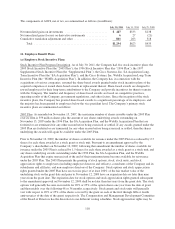
The following table summarizes significant ranges of outstanding and exercisable stock options as of July 30,
2011 (in millions, except years and share prices):
STOCK OPTIONS OUTSTANDING STOCK OPTIONS EXERCISABLE
Range of Exercise Prices
Number
Outstanding
Weighted-
Average
Remaining
Contractual
Life
(in Years)
Weighted-
Average
Exercise
Price per
Share
Aggregate
Intrinsic
Value
Number
Exercisable
Weighted-
Average
Exercise
Price per
Share
Aggregate
Intrinsic
Value
$ 0.01 – 15.00 .............. 56 1.59 $10.62 $300 54 $10.74 $282
15.01 – 18.00 .............. 97 3.03 17.72 2 96 17.72 2
18.01 – 20.00 .............. 167 1.91 19.29 — 166 19.29 —
20.01 – 25.00 .............. 154 3.87 22.75 — 144 22.75 —
25.01 – 35.00 .............. 147 5.08 30.65 — 115 30.62 —
Total .................. 621 3.29 $21.79 $302 575 $21.37 $284
The aggregate intrinsic value in the preceding table represents the total pretax intrinsic value, based on the
Company’s closing stock price of $15.97 as of July 29, 2011, which would have been received by the option
holders had those option holders exercised their stock options as of that date. The total number of in-the-money
stock options exercisable as of July 30, 2011 was 57 million. As of July 31, 2010, 606 million outstanding stock
options were exercisable and the weighted-average exercise price was $20.51.
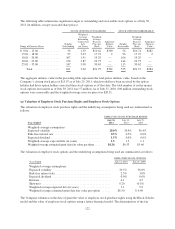
(g) Valuation of Employee Stock Purchase Rights and Employee Stock Options
The valuation of employee stock purchase rights and the underlying assumptions being used are summarized as
follows:
EMPLOYEE STOCK PURCHASE RIGHTS
Years Ended
July 30,
2011
July 31,
2010
July 25,
2009
Weighted-average assumptions:
Expected volatility ................................. 28.0% 30.9% 36.4%
Risk-free interest rate ............................... 0.3% 0.5% 0.6%
Expected dividend .................................. 1.5% 0.0% 0.0%
Weighted-average expected life (in years) ............... 1.3 1.3 1.1
Weighted-average estimated grant date fair value per share ....
$4.24 $6.53 $5.46
The valuation of employee stock options and the underlying assumptions being used are summarized as follows:
EMPLOYEE STOCK OPTIONS
Years Ended July 31, 2010 July 25, 2009
Weighted-average assumptions:
Expected volatility ....................................... 30.5% 36.0%
Risk-free interest rate ..................................... 2.3% 3.0%
Expected dividend ....................................... 0.0% 0.0%
Kurtosis ................................................ 4.1 4.5
Skewness .............................................. 0.20 (0.19)
Weighted-average expected life (in years) ..................... 5.1 5.9
Weighted-average estimated grant date fair value per option ...... $6.50 $ 6.60
The Company estimates on the date of grant the value of employee stock purchase rights using the Black-Scholes
model and the value of employee stock options using a lattice-binomial model. The determination of the fair
122