Cisco 2011 Annual Report Download - page 49
Download and view the complete annual report
Please find page 49 of the 2011 Cisco annual report below. You can navigate through the pages in the report by either clicking on the pages listed below, or by using the keyword search tool below to find specific information within the annual report.-
 1
1 -
2
-
3
-
4
-
5
-
6
-
7
-
8
-
9
-
10
-
11
-
12
-
13
-
14
-
15
-
16
-
17
-
18
-
19
-
20
-
21
-
22
-
23
-
24
-
25
-
26
-
27
-
28
-
29
-
30
-
31
-
32
-
33
-
34
-
35
-
36
-
37
-
38
-
 39
39 -
 40
40 -
 41
41 -
 42
42 -
 43
43 -
 44
44 -
 45
45 -
 46
46 -
 47
47 -
 48
48 -
 49
49 -
 50
50 -
 51
51 -
 52
52 -
 53
53 -
 54
54 -
 55
55 -
 56
56 -
 57
57 -
 58
58 -
 59
59 -
60
-
61
-
62
-
63
-
64
-
65
-
66
-
67
-
68
-
69
-
70
-
71
-
72
-
73
-
74
-
75
-
76
-
77
-
78
-
79
-
80
-
81
-
82
-
83
-
84
-
85
-
86
-
87
-
88
-
89
-
90
-
91
-
92
-
93
-
94
-
95
-
96
-
97
-
98
-
99
-
100
-
101
-
102
-
103
-
104
-
105
-
106
-
107
-
108
-
109
-
110
-
111
-
112
-
113
-
114
-
115
-
116
-
117
-
118
-
119
-
120
-
121
-
122
-
123
-
124
-
125
-
126
-
127
-
128
-
129
-
130
-
131
-
132
-
133
-
134
-
135
-
136
-
137
-
138
-
139
-
140
-
141
-
142
-
143
-
144
-
145
-
146
-
147
-
148
-
149
-
150
-
151
-
152
 |
 |
The competitive landscape in the enterprise data center market is changing. Very large, well-financed, and
aggressive competitors are each bringing their own new class of products to address this new market. We expect
this competitive market trend to continue. With respect to this market, we believe the network will be the
intersection of innovation through an open ecosystem and standards. We expect to see acquisitions, further
industry consolidation, and new alliances among companies as they seek to serve the enterprise data center
market. As we enter this next market phase, we expect that we will strengthen certain strategic alliances, compete
more with certain strategic alliances and partners, and perhaps also encounter new competitors in our attempt to
deliver the best solutions for our customers.
Other market transitions on which we are focusing particular attention include those related to the increased role
of video, collaboration, and networked mobility technologies. The key market transitions relative to the
convergence of video, collaboration, and networked mobility technologies, which we believe will drive
productivity and growth in network loads, appear to be evolving even more quickly and more significantly than
we had previously anticipated. Cisco TelePresence systems are one example of product offerings that have
incorporated video, collaboration, and networked mobility technologies, as customers evolve their
communications and business models. We are focused on simplifying and expanding the creation, distribution,
and use of end-to-end video solutions for businesses and consumers.
We believe that the architectural approach that has served us well in the past in addressing market opportunities
in the communications and IT industry will be adaptable to other markets. An example of a market where we aim
to apply this approach is mobility, where growth of IP traffic on handheld devices is driving the need for more
robust architectures, equipment and services in order to accommodate not only an increasing number of
worldwide mobile device users, but also increased user demand for broadband-quality business network and
consumer web applications to be delivered on such devices.
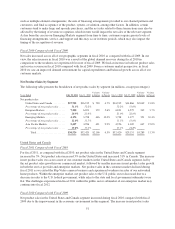
Revenue
For fiscal 2011, total revenue increased by 8%. Within total revenue, net product revenue increased 6% and net
service revenue increased 14%, each as compared with fiscal 2010. With regard to our geographic segment
performance, net revenue increased 6% in the United States and Canada segment, 6% in our European Markets
segment, 14% in our Emerging Markets segment, and 12% in our Asia Pacific Markets segment. Customer
market product revenue performance in fiscal 2011 was driven by increases, in order of largest percentage
growth, in our commercial, service provider, and enterprise markets. Our consumer market experienced a large
revenue decline in fiscal 2011, as compared with fiscal 2010, as we exited the Flip Video cameras business and
experienced weakness in sales of our networked home products.
The 6% increase in product revenue was driven by growth across most of our product categories. In particular,
our New Products category experienced a revenue increase of 14%, primarily as a result of the acquisition of
Tandberg, which was completed at the end of the third quarter of fiscal 2010. Within the New Products category,
increased revenue was driven by growth of 44% in data center and revenue growth of 31% in collaboration. In
our core product categories we experienced revenue growth of 6% in Routers, principally as a result of strength
in the high-end router product offerings, and flat revenue in our Switches product category, with single-digit
revenue growth in fixed-configuration switching products being offset by a similar revenue decline in modular
switches. The net service revenue increase was experienced across the technical support services and advanced
services categories with revenue increases of 12% and 21%, respectively, in fiscal 2011 as compared with fiscal
2010. For further details see our Discussion of Fiscal 2011, 2010 and 2009 beginning on page 50.
Gross Margin
In fiscal 2011, our gross margin percentage decreased by approximately 2.6 percentage points, as compared with
fiscal 2010. Within this total gross margin change, product gross margin declined by 3.7 percentage points, while
service gross margin increased by 1.5 percentage points. The decrease in our product gross margin percentage
was a result of higher sales discounts and unfavorable product pricing, unfavorable product mix, and
41