Cisco 2011 Annual Report Download - page 75
Download and view the complete annual report
Please find page 75 of the 2011 Cisco annual report below. You can navigate through the pages in the report by either clicking on the pages listed below, or by using the keyword search tool below to find specific information within the annual report.-
 1
1 -
2
-
3
-
4
-
5
-
6
-
7
-
8
-
9
-
10
-
11
-
12
-
13
-
14
-
15
-
16
-
17
-
18
-
19
-
20
-
21
-
22
-
23
-
24
-
25
-
26
-
27
-
28
-
29
-
30
-
31
-
32
-
33
-
34
-
35
-
36
-
37
-
38
-
39
-
40
-
41
-
42
-
43
-
44
-
45
-
46
-
47
-
48
-
49
-
50
-
51
-
52
-
53
-
54
-
55
-
56
-
57
-
58
-
59
-
60
-
61
-
62
-
63
-
64
-
 65
65 -
 66
66 -
 67
67 -
 68
68 -
 69
69 -
 70
70 -
 71
71 -
 72
72 -
 73
73 -
 74
74 -
 75
75 -
 76
76 -
 77
77 -
 78
78 -
 79
79 -
 80
80 -
 81
81 -
 82
82 -
 83
83 -
 84
84 -
 85
85 -
86
-
87
-
88
-
89
-
90
-
91
-
92
-
93
-
94
-
95
-
96
-
97
-
98
-
99
-
100
-
101
-
102
-
103
-
104
-
105
-
106
-
107
-
108
-
109
-
110
-
111
-
112
-
113
-
114
-
115
-
116
-
117
-
118
-
119
-
120
-
121
-
122
-
123
-
124
-
125
-
126
-
127
-
128
-
129
-
130
-
131
-
132
-
133
-
134
-
135
-
136
-
137
-
138
-
139
-
140
-
141
-
142
-
143
-
144
-
145
-
146
-
147
-
148
-
149
-
150
-
151
-
152
 |
 |

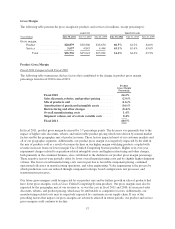
portfolio consisting primarily of high quality investment-grade securities. We believe that our strong cash and
cash equivalents and investments position allows us to use our cash resources for strategic investments to gain
access to new technologies, for acquisitions, for customer financing activities, for working capital needs, and for
the repurchase of shares of common stock and dividends.
We expect that cash provided by operating activities may fluctuate in future periods as a result of a number of
factors, including fluctuations in our operating results, the rate at which products are shipped during the quarter
(which we refer to as shipment linearity), the timing and collection of accounts receivable and financing
receivables, inventory and supply chain management, deferred revenue, excess tax benefits resulting from share-
based compensation, and the timing and amount of tax and other payments. For additional discussion, see “Part I,
Item 1A. Risk Factors” in this report.
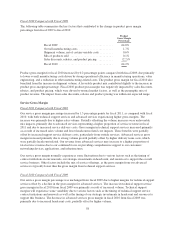
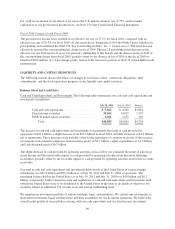
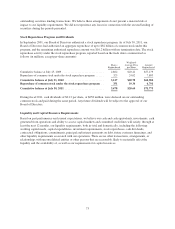
Accounts Receivable, Net The following table summarizes our accounts receivable, net (in millions), and DSO:
July 30, 2011 July 31, 2010 Decrease
Accounts receivable, net ....................... $4,698 $4,929 $(231)
DSO ...................................... 38 41 (3)
Our accounts receivable net, as of July 30, 2011 declined by approximately 5% compared with the end of fiscal
2010. Our DSO as of July 30, 2011 was lower by 3 days compared with the end of fiscal 2010. During the fourth
quarter of fiscal 2011, our cash collections were strong, and both product and services billings linearity
improved, particularly with respect to the timing of product shipments.
Services billings have traditionally had the effect of increasing DSO due in part to the timing of billings which in
comparison to product billings, have a larger proportion billed in the latter part of the quarter. As services
revenues have increased as a percentage of our total revenue, this has contributed to a higher DSO level in
comparison to levels we experienced in past years. We believe that the current DSO level is in line with levels we
expect in the near future.
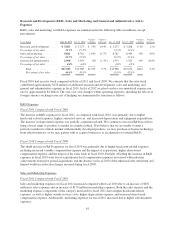
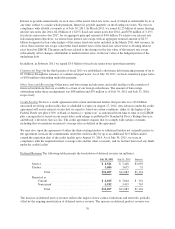
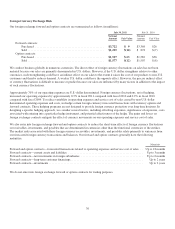
Inventories and Purchase Commitments with Contract Manufacturers and Suppliers The following table
summarizes our inventories and purchase commitments with contract manufacturers and suppliers (in millions,
except annualized inventory turns):
July 30, 2011 July 31, 2010
Increase
(Decrease)
Inventories ................................................... $1,486 $1,327 $159
Annualized inventory turns ...................................... 11.8 12.6 (0.8)
Purchase commitments with contract manufacturers and suppliers ....... $4,313 $4,319 $ (6)
Inventories as of July 30, 2011 increased by 12% from our balance at the end of fiscal 2010, while for the same
period purchase commitments with contract manufacturers and suppliers were flat. On a combined basis,
inventories and purchase commitments with contract manufacturers and suppliers increased by 3% from the
balance at the end of fiscal 2010. We believe our inventory and purchase commitments are in line with our
current demand forecasts.
The inventory increase was due to higher levels of distributor inventory and higher deferred cost of sales. Our
inventories have decreased from the levels we experienced in the first half of fiscal 2011. In the third quarter of
fiscal 2011 we announced a restructuring of our consumer business, and as a result we lowered inventory levels
for our consumer products. We also lowered inventory in certain parts of our cable set-top business. Our finished
goods consist of distributor inventory and deferred cost of sales and manufactured finished goods. Distributor
inventory and deferred cost of sales are related to unrecognized revenue on shipments to distributors and retail
partners as well as shipments to customers. Manufactured finished goods consist primarily of build-to-order and
67