Cisco 2011 Annual Report Download - page 61
Download and view the complete annual report
Please find page 61 of the 2011 Cisco annual report below. You can navigate through the pages in the report by either clicking on the pages listed below, or by using the keyword search tool below to find specific information within the annual report.-
 1
1 -
2
-
3
-
4
-
5
-
6
-
7
-
8
-
9
-
10
-
11
-
12
-
13
-
14
-
15
-
16
-
17
-
18
-
19
-
20
-
21
-
22
-
23
-
24
-
25
-
26
-
27
-
28
-
29
-
30
-
31
-
32
-
33
-
34
-
35
-
36
-
37
-
38
-
39
-
40
-
41
-
42
-
43
-
44
-
45
-
46
-
47
-
48
-
49
-
50
-
 51
51 -
 52
52 -
 53
53 -
 54
54 -
 55
55 -
 56
56 -
 57
57 -
 58
58 -
 59
59 -
 60
60 -
 61
61 -
 62
62 -
 63
63 -
 64
64 -
 65
65 -
 66
66 -
 67
67 -
 68
68 -
 69
69 -
 70
70 -
 71
71 -
72
-
73
-
74
-
75
-
76
-
77
-
78
-
79
-
80
-
81
-
82
-
83
-
84
-
85
-
86
-
87
-
88
-
89
-
90
-
91
-
92
-
93
-
94
-
95
-
96
-
97
-
98
-
99
-
100
-
101
-
102
-
103
-
104
-
105
-
106
-
107
-
108
-
109
-
110
-
111
-
112
-
113
-
114
-
115
-
116
-
117
-
118
-
119
-
120
-
121
-
122
-
123
-
124
-
125
-
126
-
127
-
128
-
129
-
130
-
131
-
132
-
133
-
134
-
135
-
136
-
137
-
138
-
139
-
140
-
141
-
142
-
143
-
144
-
145
-
146
-
147
-
148
-
149
-
150
-
151
-
152
 |
 |

compared with fiscal 2010. During fiscal 2011 we experienced weakness within our public sector market in our Asia
Pacific Markets segment. We may continue to experience challenging conditions in the public sector market in fiscal
2012. From a country perspective, net product sales increased by approximately 13% in India, 11% in China, 8% in
Australia, and 7% in Japan.
Fiscal 2010 Compared with Fiscal 2009
The increase in net product sales in the Asia Pacific Markets segment in fiscal 2010 compared with fiscal 2009 was
attributable to increased product sales to our enterprise, commercial, and service provider markets in this segment. In
fiscal 2010 we experienced strength in most countries, including China, Australia and Japan, each of which is among
the largest countries in this segment.
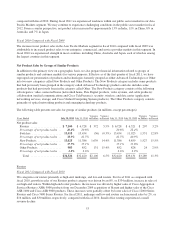
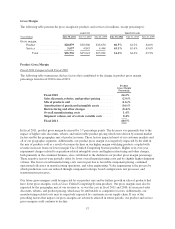
Net Product Sales by Groups of Similar Products
In addition to the primary view on a geographic basis, we also prepare financial information related to groups of
similar products and customer markets for various purposes. Effective as of the first quarter of fiscal 2011, we have
regrouped our presentation of products and technologies formerly grouped as either Advanced Technologies or Other
into two new categories called New Products and Other Products. The New Products category includes some products
that had previously been grouped in the category called Advanced Technology products and also includes some
products that had previously been in the category called Other. The New Products category consists of the following
subcategories: video connected home (networked home, Pure Digital products, video systems, and cable products);
collaboration (unified communications and Cisco TelePresence); security; wireless; and data center (application
networking services, storage, and Cisco Unified Computing System products). The Other Products category consists
primarily of optical networking products and emerging technology products.
The following table presents net sales for groups of similar products (in millions, except percentages):
Years Ended July 30, 2011 July 31, 2010
Variance
in Dollars
Variance
in Percent July 31, 2010 July 25, 2009
Variance
in Dollars
Variance
in Percent
Net product sales:
Routers ..................... $ 7,100 $ 6,728 $ 372 5.5% $ 6,728 $ 6,521 $ 207 3.2%
Percentage of net product sales .. 20.6% 20.8% 20.8% 22.4%
Switches .................... 13,418 13,454 (36) (0.3%) 13,454 11,923 1,531 12.8%
Percentage of net product sales .. 38.9% 41.5% 41.5% 40.9%
New Products ................ 13,025 11,386 1,639 14.4% 11,386 9,859 1,527 15.5%
Percentage of net product sales .. 37.7% 35.1% 35.1% 33.8%
Other Products ............... 983 852 131 15.4% 852 828 24 2.9%
Percentage of net product sales .. 2.8% 2.6% 2.6% 2.9%
Total ..................... $34,526 $32,420 $2,106 6.5% $32,420 $29,131 $3,289 11.3%
Routers
Fiscal 2011 Compared with Fiscal 2010
We categorize our routers primarily as high-end, midrange, and low-end routers. For fiscal 2011 as compared with
fiscal 2010, growth in sales of our Routers product category was driven by an 8%, or $334 million, increase in sales of
our high-end routers. Within high-end router products, the increase was driven by higher sales of Cisco Aggregation
Services Routers (ASR) 5000 products from our December 2009 acquisition of Starent and higher sales of the Cisco
ASR 1000 and Cisco ASR 9000 products. These increases were partially offset by lower sales of Cisco 12000 Series
Routers and Cisco 7600 Series Routers. For fiscal 2011, midrange and low-end routers each increased sales by 2%, or
$16 million, and $30 million, respectively, compared with fiscal 2010. Small office routing experienced a small
revenue decline.
53