Cisco 2011 Annual Report Download - page 107
Download and view the complete annual report
Please find page 107 of the 2011 Cisco annual report below. You can navigate through the pages in the report by either clicking on the pages listed below, or by using the keyword search tool below to find specific information within the annual report.-
 1
1 -
2
-
3
-
4
-
5
-
6
-
7
-
8
-
9
-
10
-
11
-
12
-
13
-
14
-
15
-
16
-
17
-
18
-
19
-
20
-
21
-
22
-
23
-
24
-
25
-
26
-
27
-
28
-
29
-
30
-
31
-
32
-
33
-
34
-
35
-
36
-
37
-
38
-
39
-
40
-
41
-
42
-
43
-
44
-
45
-
46
-
47
-
48
-
49
-
50
-
51
-
52
-
53
-
54
-
55
-
56
-
57
-
58
-
59
-
60
-
61
-
62
-
63
-
64
-
65
-
66
-
67
-
68
-
69
-
70
-
71
-
72
-
73
-
74
-
75
-
76
-
77
-
78
-
79
-
80
-
81
-
82
-
83
-
84
-
85
-
86
-
87
-
88
-
89
-
90
-
91
-
92
-
93
-
94
-
95
-
96
-
 97
97 -
 98
98 -
 99
99 -
 100
100 -
 101
101 -
 102
102 -
 103
103 -
 104
104 -
 105
105 -
 106
106 -
 107
107 -
 108
108 -
 109
109 -
 110
110 -
 111
111 -
 112
112 -
 113
113 -
 114
114 -
 115
115 -
 116
116 -
 117
117 -
118
-
119
-
120
-
121
-
122
-
123
-
124
-
125
-
126
-
127
-
128
-
129
-
130
-
131
-
132
-
133
-
134
-
135
-
136
-
137
-
138
-
139
-
140
-
141
-
142
-
143
-
144
-
145
-
146
-
147
-
148
-
149
-
150
-
151
-
152
 |
 |

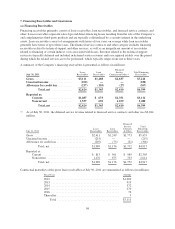
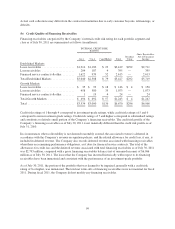
Actual cash collections may differ from the contractual maturities due to early customer buyouts, refinancings, or
defaults.
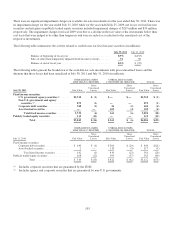
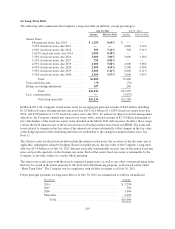
(b) Credit Quality of Financing Receivables
Financing receivables categorized by the Company’s internal credit risk rating for each portfolio segment and
class as of July 30, 2011 are summarized as follows (in millions):
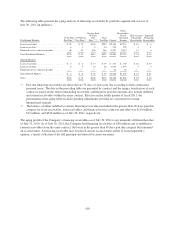
INTERNAL CREDIT RISK
RATING
1to4 5to6 7 and Higher Total
Residual
Value
Gross Receivables,
Net of Unearned
Income
Established Markets
Lease receivables ...................... $1,214 $1,182 $ 23 $2,419 $292 $2,711
Loan receivables ...................... 204 187 4 395 — 395
Financed service contracts & other ........ 1,622 939 52 2,613 — 2,613
Total Established Markets ............... $3,040 $2,308 $ 79 $5,427 $292 $5,719
Growth Markets
Lease receivables ...................... $ 35 $ 93 $ 18 $ 146 $ 4 $ 150
Loan receivables ...................... 458 580 35 1,073 — 1,073
Financed service contracts & other ........ 1 19 4 24 — 24
Total Growth Markets .................. $ 494 $ 692 $ 57 $1,243 $ 4 $1,247
Total ................................ $3,534 $3,000 $136 $6,670 $296 $6,966
Credit risk ratings of 1 through 4 correspond to investment-grade ratings, while credit risk ratings of 5 and 6
correspond to non-investment-grade ratings. Credit risk ratings of 7 and higher correspond to substandard ratings
and constitute a relatively small portion of the Company’s financing receivables. The credit risk profile of the
Company’s financing receivables as of July 30, 2011 is not materially different than the credit risk profile as of
July 31, 2010.
In circumstances when collectability is not deemed reasonably assured, the associated revenue is deferred in
accordance with the Company’s revenue recognition policies, and the related allowance for credit loss, if any, is
included in deferred revenue. The Company also records deferred revenue associated with financing receivables
when there are remaining performance obligations, as it does for financed service contracts. The total of the
allowances for credit loss and the deferred revenue associated with total financing receivables as of July 30, 2011
was $2,793 million, compared with a gross financing receivables balance (net of unearned income) of $6,966
million as of July 30, 2011. The losses that the Company has incurred historically with respect to its financing
receivables have been immaterial and consistent with the performance of an investment-grade portfolio.
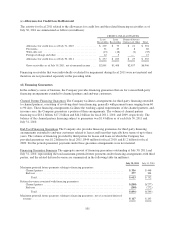
As of July 30, 2011, the portion of the portfolio that was deemed to be impaired, generally with a credit risk
rating of 8 or higher, was immaterial. The total net write-offs of financing receivables were not material for fiscal
2011. During fiscal 2011, the Company did not modify any financing receivables.
99