Cisco 2011 Annual Report Download - page 115
Download and view the complete annual report
Please find page 115 of the 2011 Cisco annual report below. You can navigate through the pages in the report by either clicking on the pages listed below, or by using the keyword search tool below to find specific information within the annual report.-
 1
1 -
2
-
3
-
4
-
5
-
6
-
7
-
8
-
9
-
10
-
11
-
12
-
13
-
14
-
15
-
16
-
17
-
18
-
19
-
20
-
21
-
22
-
23
-
24
-
25
-
26
-
27
-
28
-
29
-
30
-
31
-
32
-
33
-
34
-
35
-
36
-
37
-
38
-
39
-
40
-
41
-
42
-
43
-
44
-
45
-
46
-
47
-
48
-
49
-
50
-
51
-
52
-
53
-
54
-
55
-
56
-
57
-
58
-
59
-
60
-
61
-
62
-
63
-
64
-
65
-
66
-
67
-
68
-
69
-
70
-
71
-
72
-
73
-
74
-
75
-
76
-
77
-
78
-
79
-
80
-
81
-
82
-
83
-
84
-
85
-
86
-
87
-
88
-
89
-
90
-
91
-
92
-
93
-
94
-
95
-
96
-
97
-
98
-
99
-
100
-
101
-
102
-
103
-
104
-
 105
105 -
 106
106 -
 107
107 -
 108
108 -
 109
109 -
 110
110 -
 111
111 -
 112
112 -
 113
113 -
 114
114 -
 115
115 -
 116
116 -
 117
117 -
 118
118 -
 119
119 -
 120
120 -
 121
121 -
 122
122 -
 123
123 -
 124
124 -
 125
125 -
126
-
127
-
128
-
129
-
130
-
131
-
132
-
133
-
134
-
135
-
136
-
137
-
138
-
139
-
140
-
141
-
142
-
143
-
144
-
145
-
146
-
147
-
148
-
149
-
150
-
151
-
152
 |
 |

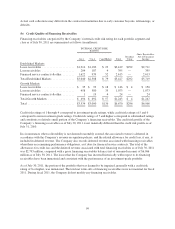
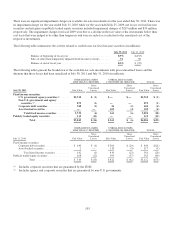
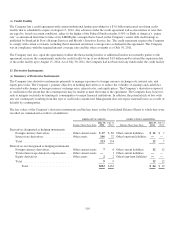
(c) Assets and Liabilities Measured at Fair Value on a Nonrecurring Basis
The following tables present the Company’s financial instruments and nonfinancial assets that were measured at fair value on a
nonrecurring basis during the indicated periods and the related recognized gains and losses for the periods (in millions):
FAIR VALUE MEASUREMENTS USING
Net Carrying
Value as of
July 30, 2011 Level 1 Level 2 Level 3
Total Losses
for the
Year Ended
July 30, 2011
Investments in privately held companies ..........
$ 13 $ — $ — $ 13 $ (10)
Purchased intangible assets ..................... $ — $ — $ — $ — (164)
Property held for sale .......................... $ 20 $ — $ — $ 20 (38)
Manufacturing operations held for sale ........... $ 167 $ — $ — $ 167 (61)
Total .................................... $(273)
FAIR VALUE MEASUREMENTS USING
Net Carrying
Value as of
July 31, 2010 Level 1 Level 2 Level 3
Total (Losses)
Gains
for the
Year Ended
July 31, 2010
Investments in privately held companies ............ $ 45 $— $— $ 45 $ (25)
Purchased intangible assets ....................... $— $— $— $— (28)
Property held for sale ........................... $ 25 $— $— $ 25 (86)
Gains on assets no longer held as of July 31, 2010 .... 2
Total .................................... $(137)
The assets in the preceding tables were classified as Level 3 assets because the Company used unobservable inputs to value them,
reflecting the Company’s assessment of the assumptions market participants would use in pricing these assets due to the absence of
quoted market prices and the inherent lack of liquidity. These assets were measured at fair value due to events or circumstances the
Company identified as having significantly impacted the fair value during the respective indicated periods.
The fair value for investments in privately held companies was measured using financial metrics, comparison to other private and
public companies, and analysis of the financial condition and near-term prospects of the issuers, including recent financing
activities and their capital structure as well as other economic variables. The impairment as a result of the evaluation for the
investments in privately held companies was recorded to other income (loss), net.
The fair value for purchased intangible assets for which the carrying amount was not deemed to be recoverable was determined
using the future discounted cash flows that the assets are expected to generate. The difference between the estimated fair value and
the carrying value of the assets was recorded as an impairment charge, which was included in product cost of sales and operating
expenses as applicable. See Note 4.
The fair value of property held for sale was measured using discounted cash flow techniques.
107