Cisco 2011 Annual Report Download - page 102
Download and view the complete annual report
Please find page 102 of the 2011 Cisco annual report below. You can navigate through the pages in the report by either clicking on the pages listed below, or by using the keyword search tool below to find specific information within the annual report.-
 1
1 -
2
-
3
-
4
-
5
-
6
-
7
-
8
-
9
-
10
-
11
-
12
-
13
-
14
-
15
-
16
-
17
-
18
-
19
-
20
-
21
-
22
-
23
-
24
-
25
-
26
-
27
-
28
-
29
-
30
-
31
-
32
-
33
-
34
-
35
-
36
-
37
-
38
-
39
-
40
-
41
-
42
-
43
-
44
-
45
-
46
-
47
-
48
-
49
-
50
-
51
-
52
-
53
-
54
-
55
-
56
-
57
-
58
-
59
-
60
-
61
-
62
-
63
-
64
-
65
-
66
-
67
-
68
-
69
-
70
-
71
-
72
-
73
-
74
-
75
-
76
-
77
-
78
-
79
-
80
-
81
-
82
-
83
-
84
-
85
-
86
-
87
-
88
-
89
-
90
-
91
-
 92
92 -
 93
93 -
 94
94 -
 95
95 -
 96
96 -
 97
97 -
 98
98 -
 99
99 -
 100
100 -
 101
101 -
 102
102 -
 103
103 -
 104
104 -
 105
105 -
 106
106 -
 107
107 -
 108
108 -
 109
109 -
 110
110 -
 111
111 -
 112
112 -
113
-
114
-
115
-
116
-
117
-
118
-
119
-
120
-
121
-
122
-
123
-
124
-
125
-
126
-
127
-
128
-
129
-
130
-
131
-
132
-
133
-
134
-
135
-
136
-
137
-
138
-
139
-
140
-
141
-
142
-
143
-
144
-
145
-
146
-
147
-
148
-
149
-
150
-
151
-
152
 |
 |

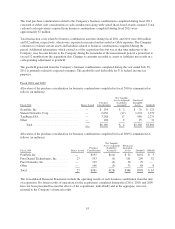
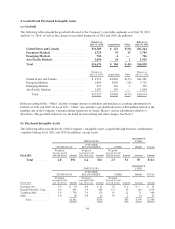
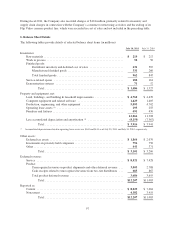
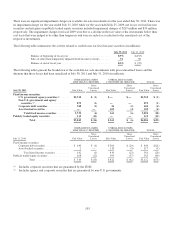
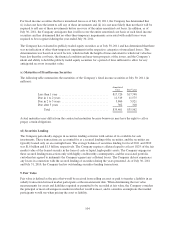
4. Goodwill and Purchased Intangible Assets
(a) Goodwill
The following tables present the goodwill allocated to the Company’s reportable segments as of July 30, 2011
and July 31, 2010, as well as the changes to goodwill during fiscal 2011 and 2010 (in millions):
Balance at
July 31, 2010 Acquisitions Other
Balance at
July 30, 2011
United States and Canada ................. $11,289 $ 121 $ (66) $11,344
European Markets ....................... 2,729 35 25 2,789
Emerging Markets ....................... 762 4 — 766
Asia Pacific Markets ...................... 1,894 24 1 1,919
Total ................................... $16,674 $ 184 $ (40) $16,818
Balance at
July 25, 2009 Acquisitions Other
Balance at
July 31, 2010
United States and Canada ................... $ 9,512 $1,802 $ (25) $11,289
European Markets ......................... 1,669 1,089 (29) 2,729
Emerging Markets ......................... 437 324 1 762
Asia Pacific Markets ....................... 1,307 587 — 1,894
Total ............................... $12,925 $3,802 $ (53) $16,674
In the preceding tables, “Other” includes foreign currency translation and purchase accounting adjustments for
both fiscal 2011 and 2010. In fiscal 2011, “Other” also includes a goodwill reduction of $63 million related to the
pending sale of the Company’s manufacturing operations in Juarez, Mexico, and an adjustment related to a
divestiture. The goodwill reduction was included in restructuring and other charges. See Note 5.
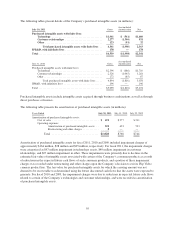
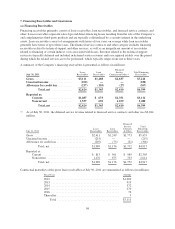
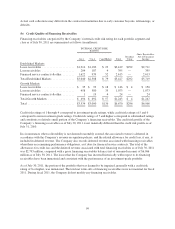
(b) Purchased Intangible Assets
The following tables present details of the Company’s intangible assets acquired through business combinations
completed during fiscal 2011 and 2010 (in millions, except years):
FINITE LIVES
INDEFINITE
LIVES
TOTALTECHNOLOGY
CUSTOMER
RELATIONSHIPS OTHER IPR&D
Fiscal 2011
Weighted-
Average Useful
Life (in Years) Amount
Weighted-
Average Useful
Life (in Years) Amount
Weighted-
Average Useful
Life (in Years) Amount Amount Amount
Total ........... 4.8 $92 6.4 $16 2.5 $1 $5 $114
FINITE LIVES
INDEFINITE
LIVES
TOTALTECHNOLOGY
CUSTOMER
RELATIONSHIPS OTHER IPR&D
Fiscal 2010
Weighted-
Average Useful
Life (in Years) Amount
Weighted-
Average Useful
Life (in Years) Amount
Weighted-
Average Useful
Life (in Years) Amount Amount Amount
ScanSafe, Inc. ........... 5.0 $ 14 6.0 $ 11 3.0 $ 6 $— $ 31
Starent Networks, Corp. . . . 6.0 691 7.0 434 0.3 35 114 1,274
Tandberg ASA .......... 5.0 709 7.0 179 3.0 21 71 980
Other ................. 4.0 68 4.8 12 1.0 1 14 95
Total .............. $1,482 $636 $63 $ 199 $2,380
94