Cisco 2011 Annual Report Download - page 129
Download and view the complete annual report
Please find page 129 of the 2011 Cisco annual report below. You can navigate through the pages in the report by either clicking on the pages listed below, or by using the keyword search tool below to find specific information within the annual report.-
 1
1 -
2
-
3
-
4
-
5
-
6
-
7
-
8
-
9
-
10
-
11
-
12
-
13
-
14
-
15
-
16
-
17
-
18
-
19
-
20
-
21
-
22
-
23
-
24
-
25
-
26
-
27
-
28
-
29
-
30
-
31
-
32
-
33
-
34
-
35
-
36
-
37
-
38
-
39
-
40
-
41
-
42
-
43
-
44
-
45
-
46
-
47
-
48
-
49
-
50
-
51
-
52
-
53
-
54
-
55
-
56
-
57
-
58
-
59
-
60
-
61
-
62
-
63
-
64
-
65
-
66
-
67
-
68
-
69
-
70
-
71
-
72
-
73
-
74
-
75
-
76
-
77
-
78
-
79
-
80
-
81
-
82
-
83
-
84
-
85
-
86
-
87
-
88
-
89
-
90
-
91
-
92
-
93
-
94
-
95
-
96
-
97
-
98
-
99
-
100
-
101
-
102
-
103
-
104
-
105
-
106
-
107
-
108
-
109
-
110
-
111
-
112
-
113
-
114
-
115
-
116
-
117
-
118
-
 119
119 -
 120
120 -
 121
121 -
 122
122 -
 123
123 -
 124
124 -
 125
125 -
 126
126 -
 127
127 -
 128
128 -
 129
129 -
 130
130 -
 131
131 -
 132
132 -
 133
133 -
 134
134 -
 135
135 -
 136
136 -
 137
137 -
 138
138 -
 139
139 -
140
-
141
-
142
-
143
-
144
-
145
-
146
-
147
-
148
-
149
-
150
-
151
-
152
 |
 |

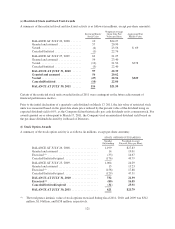
(e) Restricted Stock and Stock Unit Awards
A summary of the restricted stock and stock unit activity is as follows (in millions, except per-share amounts):
Restricted Stock/
Stock Units
Weighted-Average
Grant Date Fair
Value per Share
Aggregated Fair
Market Value
BALANCE AT JULY 26, 2008 ....... 10 $24.27
Granted and assumed ............... 57 20.90
Vested ........................... (4) 23.56 $ 69
Canceled/forfeited .................. (1) 22.76
BALANCE AT JULY 25, 2009 ....... 62 21.25
Granted and assumed ............... 54 23.40
Vested ........................... (16) 21.56 $378
Canceled/forfeited .................. (3) 22.40
BALANCE AT JULY 31, 2010 ...... 97 22.35
Granted and assumed .............. 56 20.62
Vested ........................... (27) 22.54 $529
Canceled/forfeited ................. (10) 22.04
BALANCE AT JULY 30, 2011 ...... 116 $21.50
Certain of the restricted stock units awarded in fiscal 2011 were contingent on the future achievement of
financial performance metrics.
Prior to the initial declaration of a quarterly cash dividend on March 17, 2011, the fair value of restricted stock
units was measured based on the grant date share price reduced by the present value of the dividend using an
expected dividend yield of 0%, as the Company did not historically pay cash dividends on its common stock. For
awards granted on or subsequent to March 17, 2011, the Company used an annualized dividend yield based on
the per-share dividends declared by its Board of Directors.
(f) Stock Option Awards
A summary of the stock option activity is as follows (in millions, except per-share amounts):
STOCK OPTIONS OUTSTANDING
Number
Outstanding
Weighted-Average
Exercise Price per Share
BALANCE AT JULY 26, 2008 ................... 1,199 $27.83
Granted and assumed ........................... 14 19.01
Exercised (1) .................................. (33) 14.67
Canceled/forfeited/expired ....................... (176) 49.79
BALANCE AT JULY 25, 2009 ................... 1,004 24.29
Granted and assumed ........................... 15 13.23
Exercised (1) .................................. (158) 17.88
Canceled/forfeited/expired ....................... (129) 47.31
BALANCE AT JULY 31, 2010 .................. 732 21.39
Exercised (1) .................................. (80) 16.55
Canceled/forfeited/expired ..................... (31) 25.91
BALANCE AT JULY 30, 2011 .................. 621 $21.79
(1) The total pretax intrinsic value of stock options exercised during fiscal 2011, 2010, and 2009 was $312
million, $1.0 billion, and $158 million, respectively.
121