Cisco 2011 Annual Report Download - page 58
Download and view the complete annual report
Please find page 58 of the 2011 Cisco annual report below. You can navigate through the pages in the report by either clicking on the pages listed below, or by using the keyword search tool below to find specific information within the annual report.-
 1
1 -
2
-
3
-
4
-
5
-
6
-
7
-
8
-
9
-
10
-
11
-
12
-
13
-
14
-
15
-
16
-
17
-
18
-
19
-
20
-
21
-
22
-
23
-
24
-
25
-
26
-
27
-
28
-
29
-
30
-
31
-
32
-
33
-
34
-
35
-
36
-
37
-
38
-
39
-
40
-
41
-
42
-
43
-
44
-
45
-
46
-
47
-
 48
48 -
 49
49 -
 50
50 -
 51
51 -
 52
52 -
 53
53 -
 54
54 -
 55
55 -
 56
56 -
 57
57 -
 58
58 -
 59
59 -
 60
60 -
 61
61 -
 62
62 -
 63
63 -
 64
64 -
 65
65 -
 66
66 -
 67
67 -
 68
68 -
69
-
70
-
71
-
72
-
73
-
74
-
75
-
76
-
77
-
78
-
79
-
80
-
81
-
82
-
83
-
84
-
85
-
86
-
87
-
88
-
89
-
90
-
91
-
92
-
93
-
94
-
95
-
96
-
97
-
98
-
99
-
100
-
101
-
102
-
103
-
104
-
105
-
106
-
107
-
108
-
109
-
110
-
111
-
112
-
113
-
114
-
115
-
116
-
117
-
118
-
119
-
120
-
121
-
122
-
123
-
124
-
125
-
126
-
127
-
128
-
129
-
130
-
131
-
132
-
133
-
134
-
135
-
136
-
137
-
138
-
139
-
140
-
141
-
142
-
143
-
144
-
145
-
146
-
147
-
148
-
149
-
150
-
151
-
152
 |
 |

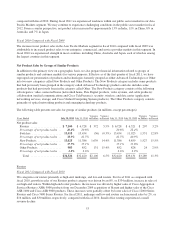
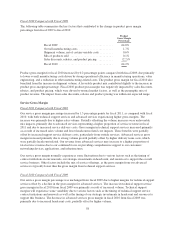
DISCUSSION OF FISCAL 2011, 2010, AND 2009
Fiscal 2011, 2010, and 2009 were 52, 53, and 52-week fiscal years, respectively.
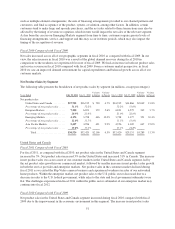
Net Sales
The following table presents the breakdown of net sales between product and service revenue (in millions, except
percentages):
Years Ended July 30, 2011 July 31, 2010
Variance
in Dollars
Variance
in Percent July 31, 2010 July 25, 2009
Variance
in Dollars
Variance
in Percent
Net sales:
Product .................... $ 34,526 $ 32,420 $ 2,106 6.5% $ 32,420 $ 29,131 $ 3,289 11.3%
Percentage of net sales ........ 79.9% 81.0% 81.0% 80.7%
Service .................... 8,692 7,620 1,072 14.1% 7,620 6,986 634 9.1%
Percentage of net sales ........ 20.1% 19.0% 19.0% 19.3%
Total .................. $ 43,218 $ 40,040 $ 3,178 7.9% $ 40,040 $ 36,117 $ 3,923 10.9%
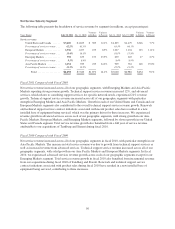
We manage our business primarily on a geographic basis, organized into four geographic segments. Our net
sales, which include product and service revenue for each segment are summarized in the following table (in
millions, except percentages):
Years Ended July 30, 2011 July 31, 2010
Variance
in Dollars
Variance
in Percent July 31, 2010 July 25, 2009
Variance
in Dollars
Variance
in Percent
Net sales:
United States and Canada . .
$ 23,115 $ 21,740 $ 1,375 6.3% $ 21,740 $ 19,345 $ 2,395 12.4%
Percentage of net sales .... 53.5% 54.3% 54.3% 53.5%
European Markets ....... 8,536 8,048 488 6.1% 8,048 7,683 365 4.8%
Percentage of net sales .... 19.8% 20.1% 20.1% 21.3%
Emerging Markets ....... 4,966 4,367 599 13.7% 4,367 3,999 368 9.2%
Percentage of net sales .... 11.4% 10.9% 10.9% 11.1%
Asia Pacific Markets ..... 6,601 5,885 716 12.2% 5,885 5,090 795 15.6%
Percentage of net sales .... 15.3% 14.7% 14.7% 14.1%
Total ........... $43,218 $40,040 $3,178 7.9% $40,040 $36,117 $3,923 10.9%
Fiscal 2011 Compared with Fiscal 2010
For fiscal 2011, as compared with fiscal 2010, net sales increased by 8%. Within total net sales growth, net
product sales increased by 6%, while service revenue increased by 14%. Our product and service revenue totals
each reflected sales growth across each of our geographic segments. The sales increase was due to customer
acceptance of the new product transitions taking place in our core business, sales growth in our New Products
category, and the strong performance of our services solutions.
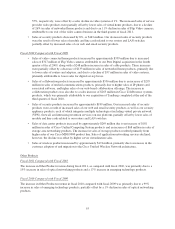
We conduct business globally in numerous currencies. The direct effect of foreign currency fluctuations on sales
has not been material because our sales are primarily denominated in U.S. dollars. However, if the U.S. dollar
strengthens relative to other currencies, such strengthening could have an indirect effect on our sales to the extent
it raises the cost of our products to non-U.S. customers and thereby reduces demand. A weaker U.S. dollar could
have the opposite effect. However, the precise indirect effect of currency fluctuations is difficult to measure or
predict because our sales are influenced by many factors in addition to the impact of such currency fluctuations.
In addition to the impact of macroeconomic factors, including a reduced IT spending environment and budget-
driven reductions in spending by government entities, net sales by segment in a particular period may be
significantly impacted by several factors related to revenue recognition, including the complexity of transactions
50