Cisco 2011 Annual Report Download - page 43
Download and view the complete annual report
Please find page 43 of the 2011 Cisco annual report below. You can navigate through the pages in the report by either clicking on the pages listed below, or by using the keyword search tool below to find specific information within the annual report.-
 1
1 -
2
-
3
-
4
-
5
-
6
-
7
-
8
-
9
-
10
-
11
-
12
-
13
-
14
-
15
-
16
-
17
-
18
-
19
-
20
-
21
-
22
-
23
-
24
-
25
-
26
-
27
-
28
-
29
-
30
-
31
-
32
-
 33
33 -
 34
34 -
 35
35 -
 36
36 -
 37
37 -
 38
38 -
 39
39 -
 40
40 -
 41
41 -
 42
42 -
 43
43 -
 44
44 -
 45
45 -
 46
46 -
 47
47 -
 48
48 -
 49
49 -
 50
50 -
 51
51 -
 52
52 -
 53
53 -
54
-
55
-
56
-
57
-
58
-
59
-
60
-
61
-
62
-
63
-
64
-
65
-
66
-
67
-
68
-
69
-
70
-
71
-
72
-
73
-
74
-
75
-
76
-
77
-
78
-
79
-
80
-
81
-
82
-
83
-
84
-
85
-
86
-
87
-
88
-
89
-
90
-
91
-
92
-
93
-
94
-
95
-
96
-
97
-
98
-
99
-
100
-
101
-
102
-
103
-
104
-
105
-
106
-
107
-
108
-
109
-
110
-
111
-
112
-
113
-
114
-
115
-
116
-
117
-
118
-
119
-
120
-
121
-
122
-
123
-
124
-
125
-
126
-
127
-
128
-
129
-
130
-
131
-
132
-
133
-
134
-
135
-
136
-
137
-
138
-
139
-
140
-
141
-
142
-
143
-
144
-
145
-
146
-
147
-
148
-
149
-
150
-
151
-
152
 |
 |

PART II
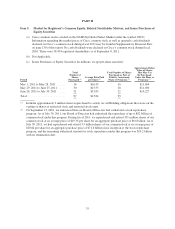
Item 5. Market for Registrant’s Common Equity, Related Stockholder Matters, and Issuer Purchases of
Equity Securities
(a) Cisco common stock is traded on the NASDAQ Global Select Market under the symbol CSCO.
Information regarding the market prices of Cisco common stock as well as quarterly cash dividends
declared on Cisco’s common stock during fiscal 2011 may be found in Supplementary Financial Data
on page 130 of this report. No cash dividends were declared on Cisco’s common stock during fiscal
2010. There were 58,434 registered shareholders as of September 8, 2011.
(b) Not Applicable.
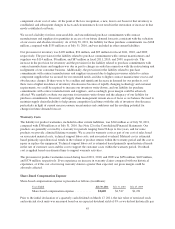
(c) Issuer Purchases of Equity Securities (in millions, except per-share amounts):
Period
Total
Number of
Shares
Purchased (1)
Average Price Paid
per Share (1)
Total Number of Shares
Purchased as Part of
Publicly Announced
Plans or Programs (2)
Approximate Dollar
Value of Shares
That May Yet
Be Purchased
Under the Plans or
Programs (2)
May 1, 2011 to May 28, 2011 ...... 16 $16.43 16 $11,464
May 29, 2011 to June 25, 2011 ..... 30 $15.53 28 $11,030
June 26, 2011 to July 30, 2011 ..... 51 $15.83 51 $10,227
Total .......................... 97 $15.84 95
(1) Includes approximately 2 million shares repurchased to satisfy tax withholding obligations that arose on the
vesting of shares of restricted stock and restricted stock units.
(2) On September 13, 2001, we announced that our Board of Directors had authorized a stock repurchase
program. As of July 30, 2011, our Board of Directors had authorized the repurchase of up to $82 billion of
common stock under this program. During fiscal 2011, we repurchased and retired 351 million shares of our
common stock at an average price of $19.36 per share for an aggregate purchase price of $6.8 billion. As of
July 30, 2011, we had repurchased and retired 3.5 billion shares of our common stock at an average price of
$20.64 per share for an aggregate purchase price of $71.8 billion since inception of the stock repurchase
program, and the remaining authorized amount for stock repurchases under this program was $10.2 billion
with no termination date.
35