Cisco 2011 Annual Report Download - page 47
Download and view the complete annual report
Please find page 47 of the 2011 Cisco annual report below. You can navigate through the pages in the report by either clicking on the pages listed below, or by using the keyword search tool below to find specific information within the annual report.-
 1
1 -
2
-
3
-
4
-
5
-
6
-
7
-
8
-
9
-
10
-
11
-
12
-
13
-
14
-
15
-
16
-
17
-
18
-
19
-
20
-
21
-
22
-
23
-
24
-
25
-
26
-
27
-
28
-
29
-
30
-
31
-
32
-
33
-
34
-
35
-
36
-
 37
37 -
 38
38 -
 39
39 -
 40
40 -
 41
41 -
 42
42 -
 43
43 -
 44
44 -
 45
45 -
 46
46 -
 47
47 -
 48
48 -
 49
49 -
 50
50 -
 51
51 -
 52
52 -
 53
53 -
 54
54 -
 55
55 -
 56
56 -
 57
57 -
58
-
59
-
60
-
61
-
62
-
63
-
64
-
65
-
66
-
67
-
68
-
69
-
70
-
71
-
72
-
73
-
74
-
75
-
76
-
77
-
78
-
79
-
80
-
81
-
82
-
83
-
84
-
85
-
86
-
87
-
88
-
89
-
90
-
91
-
92
-
93
-
94
-
95
-
96
-
97
-
98
-
99
-
100
-
101
-
102
-
103
-
104
-
105
-
106
-
107
-
108
-
109
-
110
-
111
-
112
-
113
-
114
-
115
-
116
-
117
-
118
-
119
-
120
-
121
-
122
-
123
-
124
-
125
-
126
-
127
-
128
-
129
-
130
-
131
-
132
-
133
-
134
-
135
-
136
-
137
-
138
-
139
-
140
-
141
-
142
-
143
-
144
-
145
-
146
-
147
-
148
-
149
-
150
-
151
-
152
 |
 |

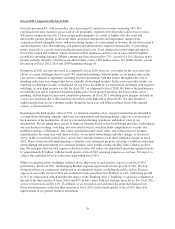
Fiscal 2011 Compared with Fiscal 2010
Net sales increased 8%, with net product sales increasing 6% and service revenue increasing 14%. We
experienced net sales increases across each of our geographic segments for both product and service revenue.
Total gross margin declined by 2.6 percentage points primarily as a result of higher sales discounts and
unfavorable product pricing, product mix shifts, increased amortization and impairment charges from
acquisition-related intangible assets, and restructuring charges. As a percentage of revenue, the total for research
and development, sales and marketing, and general and administrative expenses increased by 0.7 percentage
points, primarily as a result of increased headcount-related costs. Total charges for restructuring and other in
fiscal 2011 totaled $923 million, which consisted of $124 million recorded to cost of sales and $799 million
recorded to operating expenses. Diluted earnings per share decreased by 12%, a result of a 16% decrease in net
income, partially offset by a decline in our diluted share count of 285 million shares. For further details, see our
Discussion of Fiscal 2011, 2010 and 2009 beginning on page 50.
During fiscal 2011 net sales increased as compared to fiscal 2010; however, our results for the year reflect the
effects of certain challenges that we faced. We identified challenges with the public sector market early in the
year and we continued to experience declining business momentum with that market throughout the year as
spending reductions were being taken across virtually all developed markets. In the service provider market, we
experienced challenges in sales of traditional set-top boxes. In addition, we experienced challenges with regard to
switching, as switching revenue was flat for fiscal 2011 as compared to fiscal 2010. We believe the performance
in switching was due to continued transitions taking place in our product portfolio, the lower public sector
spending, and the impact of increased competitive pressures. In fiscal 2011 switching gross margins declined on
a year-over-year basis due to the transition of products at the high-end of the portfolio. We also identified
significant pressures in our consumer market during the fiscal year and addressed these issues with targeted
actions, as discussed below.
Beginning in the third quarter of fiscal 2011, we initiated a number of key, targeted actions that are intended to
accomplish the following: simplify and focus our organization and operating model; align our cost structure to
the transitions in the marketplace; divest or exit underperforming operations; and deliver value to our
shareholders. We are taking these actions to align our business based on five foundational priorities: leadership in
our core business (routing, switching, and associated services), which includes comprehensive security and
mobility solutions; collaboration; data center virtualization and cloud; video; and architectures for business
transformation. In connection with these activities, we incurred restructuring and other charges, as discussed
above, in the second half of fiscal 2011, and we have announced that we will incur additional charges in fiscal
2012. These actions include implementing a voluntary early retirement program, effecting a workforce reduction,
and realigning and restructuring our consumer business, most notably exiting our Flip Video cameras product
line. We anticipate that our total expense reduction actions will reduce our annualized operating expense run rate
by approximately $1 billion, with the fourth quarter of fiscal 2011 operating expenses as our base. We expect to
achieve this annualized run rate reduction target within fiscal 2012.
While we experienced the challenges outlined above, there were several positive aspects to our fiscal 2011
performance. For fiscal 2011, the Emerging Markets segment experienced revenue growth of 14%. We had
strong growth in our commercial market and in our enterprise market (excluding the public sector). Positive
aspects of our results for fiscal 2011 also included revenue growth in New Products of 14%, with strong growth
of 31% in collaboration (which includes the impact of the Tandberg ASA (“Tandberg”) acquisition completed at
the end of the third quarter of fiscal 2010) and 44% in data center, both key strategic areas for us. For fiscal 2011,
service revenue increased by 14%. In addition, as we focused on and addressed the items that impacted our
financial performance in the first three quarters of fiscal 2011, in the fourth quarter of fiscal 2011 there was
improvement in our general business momentum.
39