Cisco 2011 Annual Report Download - page 74
Download and view the complete annual report
Please find page 74 of the 2011 Cisco annual report below. You can navigate through the pages in the report by either clicking on the pages listed below, or by using the keyword search tool below to find specific information within the annual report.-
 1
1 -
2
-
3
-
4
-
5
-
6
-
7
-
8
-
9
-
10
-
11
-
12
-
13
-
14
-
15
-
16
-
17
-
18
-
19
-
20
-
21
-
22
-
23
-
24
-
25
-
26
-
27
-
28
-
29
-
30
-
31
-
32
-
33
-
34
-
35
-
36
-
37
-
38
-
39
-
40
-
41
-
42
-
43
-
44
-
45
-
46
-
47
-
48
-
49
-
50
-
51
-
52
-
53
-
54
-
55
-
56
-
57
-
58
-
59
-
60
-
61
-
62
-
63
-
 64
64 -
 65
65 -
 66
66 -
 67
67 -
 68
68 -
 69
69 -
 70
70 -
 71
71 -
 72
72 -
 73
73 -
 74
74 -
 75
75 -
 76
76 -
 77
77 -
 78
78 -
 79
79 -
 80
80 -
 81
81 -
 82
82 -
 83
83 -
 84
84 -
85
-
86
-
87
-
88
-
89
-
90
-
91
-
92
-
93
-
94
-
95
-
96
-
97
-
98
-
99
-
100
-
101
-
102
-
103
-
104
-
105
-
106
-
107
-
108
-
109
-
110
-
111
-
112
-
113
-
114
-
115
-
116
-
117
-
118
-
119
-
120
-
121
-
122
-
123
-
124
-
125
-
126
-
127
-
128
-
129
-
130
-
131
-
132
-
133
-
134
-
135
-
136
-
137
-
138
-
139
-
140
-
141
-
142
-
143
-
144
-
145
-
146
-
147
-
148
-
149
-
150
-
151
-
152
 |
 |

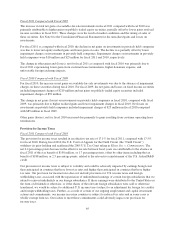
For a full reconciliation of our effective tax rate to the U.S. federal statutory rate of 35% and for further
explanation of our provision for income taxes, see Note 15 to the Consolidated Financial Statements.
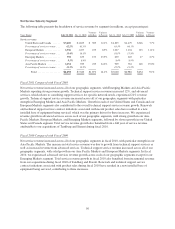
Fiscal 2010 Compared with Fiscal 2009
The provision for income taxes resulted in an effective tax rate of 17.5% for fiscal 2010, compared with an
effective tax rate of 20.3% for fiscal 2009. As discussed above, during fiscal 2010 the Ninth Circuit withdrew its
prior holding and reaffirmed the 2005 U.S. Tax Court ruling in Xilinx, Inc. v. Commissioner. This final decision
effectively reversed the corresponding tax charge in fiscal 2009. The net 2.8 percentage point decrease in the
effective tax rate between fiscal years was primarily attributable to this benefit and the absence in fiscal 2010 of
the corresponding charge from fiscal 2009, partially offset by the absence in fiscal 2010 of the fiscal 2009 tax
benefit of $106 million, or 1.4 percentage points, related to the retroactive portion of the U.S. federal R&D credit
reinstatement.
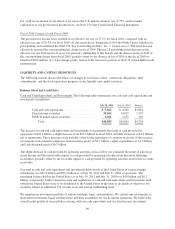
LIQUIDITY AND CAPITAL RESOURCES
The following sections discuss the effects of changes in our balance sheet, contractual obligations, other
commitments, and the stock repurchase program on our liquidity and capital resources.
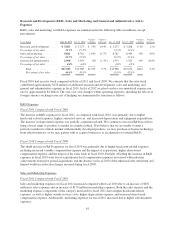
Balance Sheet and Cash Flows
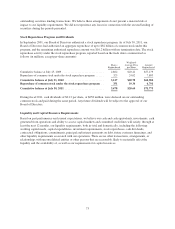
Cash and Cash Equivalents and Investments The following table summarizes our cash and cash equivalents and
investments (in millions):
July 30, 2011 July 31, 2010 Increase
Cash and cash equivalents ...................... $ 7,662 $ 4,581 $3,081
Fixed income securities ........................ 35,562 34,029 1,533
Publicly traded equity securities ................. 1,361 1,251 110
Total .................................. $44,585 $39,861 $4,724
The increase in cash and cash equivalents and investments was primarily the result of cash provided by
operations of $10.1 billion, a slight decrease from $10.2 billion in fiscal 2010, and debt issuances of $1.5 billion,
net of repayments. These increases were partially offset by the repurchase of common stock (net of the issuance
of common stock related to employee stock incentive plans) of $5.1 billion, capital expenditures of $1.2 billion,
and cash dividends paid of $0.7 billion.
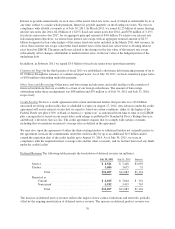
The slight decrease in cash provided by operating activities in fiscal 2011 was primarily the result of a decrease
in net income and the unfavorable impact to cash provided by operating activities from increased financing
receivables, partially offset by the favorable impact to cash provided by operating activities from lower accounts
receivable.
Our total in cash and cash equivalents and investments held outside of the United States in various foreign
subsidiaries was $39.8 billion and $33.2 billion as of July 30, 2011 and July 31, 2010, respectively. The
remaining balance held in the United States as of July 30, 2011 and July 31, 2010 was $4.8 billion and $6.7
billion, respectively. Under current tax laws and regulations, if cash and cash equivalents and investments held
outside the United States were to be distributed to the United States in the form of dividends or otherwise, we
would be subject to additional U.S. income taxes and foreign withholding taxes.
We maintain an investment portfolio of various holdings, types, and maturities. We classify our investments as
short-term investments based on their nature and their availability for use in current operations. We believe the
overall credit quality of our portfolio is strong, with our cash equivalents and our fixed income investment
66