Cisco 2011 Annual Report Download - page 138
Download and view the complete annual report
Please find page 138 of the 2011 Cisco annual report below. You can navigate through the pages in the report by either clicking on the pages listed below, or by using the keyword search tool below to find specific information within the annual report.-
 1
1 -
2
-
3
-
4
-
5
-
6
-
7
-
8
-
9
-
10
-
11
-
12
-
13
-
14
-
15
-
16
-
17
-
18
-
19
-
20
-
21
-
22
-
23
-
24
-
25
-
26
-
27
-
28
-
29
-
30
-
31
-
32
-
33
-
34
-
35
-
36
-
37
-
38
-
39
-
40
-
41
-
42
-
43
-
44
-
45
-
46
-
47
-
48
-
49
-
50
-
51
-
52
-
53
-
54
-
55
-
56
-
57
-
58
-
59
-
60
-
61
-
62
-
63
-
64
-
65
-
66
-
67
-
68
-
69
-
70
-
71
-
72
-
73
-
74
-
75
-
76
-
77
-
78
-
79
-
80
-
81
-
82
-
83
-
84
-
85
-
86
-
87
-
88
-
89
-
90
-
91
-
92
-
93
-
94
-
95
-
96
-
97
-
98
-
99
-
100
-
101
-
102
-
103
-
104
-
105
-
106
-
107
-
108
-
109
-
110
-
111
-
112
-
113
-
114
-
115
-
116
-
117
-
118
-
119
-
120
-
121
-
122
-
123
-
124
-
125
-
126
-
127
-
 128
128 -
 129
129 -
 130
130 -
 131
131 -
 132
132 -
 133
133 -
 134
134 -
 135
135 -
 136
136 -
 137
137 -
 138
138 -
 139
139 -
 140
140 -
 141
141 -
 142
142 -
 143
143 -
 144
144 -
 145
145 -
 146
146 -
 147
147 -
 148
148 -
149
-
150
-
151
-
152
 |
 |

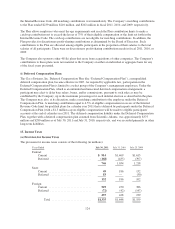
Supplementary Financial Data (Unaudited)
(in millions, except per-share amounts)
Quarters Ended July 30, 2011(1) April 30, 2011(1) January 29, 2011 October 30, 2010
Net sales ............................... $11,195 $10,866 $10,407 $10,750
Gross margin ........................... $ 6,861 $ 6,659 $ 6,261 $ 6,755
Net income (1) ........................... $ 1,232 $ 1,807 $ 1,521 $ 1,930
Net income per share—basic .............. $ 0.22 $ 0.33 $ 0.27 $ 0.34
Net income per share—diluted ............ $ 0.22 $ 0.33 $ 0.27 $ 0.34
Cash dividends declared per common share ...
$ 0.06 $ 0.06 $ — $ —
Cash and cash equivalents and investments ..
$44,585 $43,367 $40,229 $38,925
(1) Net income for the quarters ended July 30, 2011 and April 30, 2011 included restructuring and other charges of $602 million and $92
million, net of tax, respectively. See Note 5 to the Consolidated Financial Statements.
Quarters Ended July 31, 2010 May 1, 2010 January 23, 2010 October 24, 2009
Net sales ............................... $10,836 $10,368 $ 9,815 $ 9,021
Gross margin ........................... $ 6,793 $ 6,630 $ 6,332 $ 5,888
Net income ............................. $ 1,935 $ 2,192 $ 1,853 $ 1,787
Net income per share—basic ............... $ 0.34 $ 0.38 $ 0.32 $ 0.31
Net income per share—diluted ............. $ 0.33 $ 0.37 $ 0.32 $ 0.30
Cash and cash equivalents and investments . . . $39,861 $39,106 $39,638 $35,365
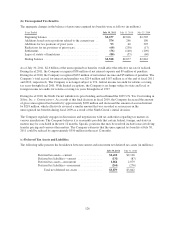
Stock Market Information
Cisco common stock is traded on the NASDAQ Global Select Market under the symbol CSCO. The following
table lists the high and low sales prices for each period indicated:
FISCAL 2011 FISCAL 2010
Fiscal High Low High Low
First quarter ................................................... $24.87 $19.82 $24.83 $20.68
Second quarter ................................................. $24.60 $19.00 $25.10 $22.55
Third quarter .................................................. $22.34 $16.52 $27.74 $22.35
Fourth quarter ................................................. $17.99 $14.78 $27.69 $20.93
130