Cisco 2011 Annual Report Download - page 110
Download and view the complete annual report
Please find page 110 of the 2011 Cisco annual report below. You can navigate through the pages in the report by either clicking on the pages listed below, or by using the keyword search tool below to find specific information within the annual report.-
 1
1 -
2
-
3
-
4
-
5
-
6
-
7
-
8
-
9
-
10
-
11
-
12
-
13
-
14
-
15
-
16
-
17
-
18
-
19
-
20
-
21
-
22
-
23
-
24
-
25
-
26
-
27
-
28
-
29
-
30
-
31
-
32
-
33
-
34
-
35
-
36
-
37
-
38
-
39
-
40
-
41
-
42
-
43
-
44
-
45
-
46
-
47
-
48
-
49
-
50
-
51
-
52
-
53
-
54
-
55
-
56
-
57
-
58
-
59
-
60
-
61
-
62
-
63
-
64
-
65
-
66
-
67
-
68
-
69
-
70
-
71
-
72
-
73
-
74
-
75
-
76
-
77
-
78
-
79
-
80
-
81
-
82
-
83
-
84
-
85
-
86
-
87
-
88
-
89
-
90
-
91
-
92
-
93
-
94
-
95
-
96
-
97
-
98
-
99
-
 100
100 -
 101
101 -
 102
102 -
 103
103 -
 104
104 -
 105
105 -
 106
106 -
 107
107 -
 108
108 -
 109
109 -
 110
110 -
 111
111 -
 112
112 -
 113
113 -
 114
114 -
 115
115 -
 116
116 -
 117
117 -
 118
118 -
 119
119 -
 120
120 -
121
-
122
-
123
-
124
-
125
-
126
-
127
-
128
-
129
-
130
-
131
-
132
-
133
-
134
-
135
-
136
-
137
-
138
-
139
-
140
-
141
-
142
-
143
-
144
-
145
-
146
-
147
-
148
-
149
-
150
-
151
-
152
 |
 |

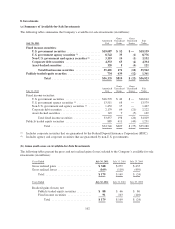
8. Investments
(a) Summary of Available-for-Sale Investments
The following tables summarize the Company’s available-for-sale investments (in millions):
July 30, 2011
Amortized
Cost
Gross
Unrealized
Gains
Gross
Unrealized
Losses
Fair
Value
Fixed income securities:
U.S. government securities ....................... $19,087 $ 52 $ — $19,139
U.S. government agency securities (1) ............... 8,742 35 (1) 8,776
Non-U.S. government and agency securities (2) ....... 3,119 14 (1) 3,132
Corporate debt securities ........................ 4,333 65 (4) 4,394
Asset-backed securities .......................... 120 5 (4) 121
Total fixed income securities ................. 35,401 171 (10) 35,562
Publicly traded equity securities ...................... 734 639 (12) 1,361
Total ................................. $36,135 $810 $ (22) $36,923
July 31, 2010
Amortized
Cost
Gross
Unrealized
Gains
Gross
Unrealized
Losses
Fair
Value
Fixed income securities:
U.S. government securities ........................ $16,570 $ 42 $ — $16,612
U.S. government agency securities (1) ................ 13,511 68 — 13,579
Non-U.S. government and agency securities (2) ........ 1,452 15 — 1,467
Corporate debt securities .......................... 2,179 64 (21) 2,222
Asset-backed securities ........................... 145 9 (5) 149
Total fixed income securities .................. 33,857 198 (26) 34,029
Publicly traded equity securities ........................ 889 411 (49) 1,251
Total .................................. $34,746 $609 $ (75) $35,280
(1) Includes corporate securities that are guaranteed by the Federal Deposit Insurance Corporation (FDIC).
(2) Includes agency and corporate securities that are guaranteed by non-U.S. governments.
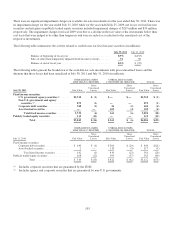
(b) Gains and Losses on Available-for-Sale Investments
The following tables present the gross and net realized gains (losses) related to the Company’s available-for-sale
investments (in millions):
Years Ended July 30, 2011 July 31, 2010 July 25, 2009
Gross realized gains ....................... $ 348 $ 279 $ 435
Gross realized losses ....................... (169) (110) (459)
Total ............................... $ 179 $ 169 $ (24)
Years Ended July 30, 2011 July 31, 2010 July 25, 2009
Realized gains (losses) net:
Publicly traded equity securities .......... $88 $66 $86
Fixed income securities ................ 91 103 (110)
Total ........................... $ 179 $ 169 $ (24)
102