Cisco 2011 Annual Report Download - page 135
Download and view the complete annual report
Please find page 135 of the 2011 Cisco annual report below. You can navigate through the pages in the report by either clicking on the pages listed below, or by using the keyword search tool below to find specific information within the annual report.-
 1
1 -
2
-
3
-
4
-
5
-
6
-
7
-
8
-
9
-
10
-
11
-
12
-
13
-
14
-
15
-
16
-
17
-
18
-
19
-
20
-
21
-
22
-
23
-
24
-
25
-
26
-
27
-
28
-
29
-
30
-
31
-
32
-
33
-
34
-
35
-
36
-
37
-
38
-
39
-
40
-
41
-
42
-
43
-
44
-
45
-
46
-
47
-
48
-
49
-
50
-
51
-
52
-
53
-
54
-
55
-
56
-
57
-
58
-
59
-
60
-
61
-
62
-
63
-
64
-
65
-
66
-
67
-
68
-
69
-
70
-
71
-
72
-
73
-
74
-
75
-
76
-
77
-
78
-
79
-
80
-
81
-
82
-
83
-
84
-
85
-
86
-
87
-
88
-
89
-
90
-
91
-
92
-
93
-
94
-
95
-
96
-
97
-
98
-
99
-
100
-
101
-
102
-
103
-
104
-
105
-
106
-
107
-
108
-
109
-
110
-
111
-
112
-
113
-
114
-
115
-
116
-
117
-
118
-
119
-
120
-
121
-
122
-
123
-
124
-
 125
125 -
 126
126 -
 127
127 -
 128
128 -
 129
129 -
 130
130 -
 131
131 -
 132
132 -
 133
133 -
 134
134 -
 135
135 -
 136
136 -
 137
137 -
 138
138 -
 139
139 -
 140
140 -
 141
141 -
 142
142 -
 143
143 -
 144
144 -
 145
145 -
146
-
147
-
148
-
149
-
150
-
151
-
152
 |
 |

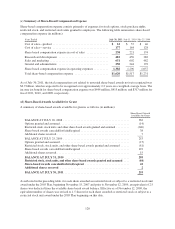
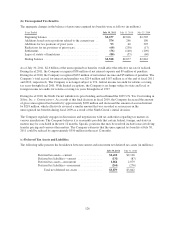
The components of the deferred tax assets and liabilities are as follows (in millions):
July 30, 2011 July 31, 2010
ASSETS
Allowance for doubtful accounts and returns ................................. $ 413 $ 248
Sales-type and direct-financing leases ....................................... 178 224
Inventory write-downs and capitalization .................................... 160 176
Investment provisions ................................................... 226 329
IPR&D, goodwill, and purchased intangible assets ............................. 106 191
Deferred revenue ....................................................... 1,634 1,752
Credits and net operating loss carryforwards .................................. 713 752
Share-based compensation expense ......................................... 1,084 970
Accrued compensation ................................................... 507 339
Other ................................................................. 590 517
Gross deferred tax assets ............................................. 5,611 5,498
Valuation allowance ................................................. (82) (76)
Total deferred tax assets .............................................. 5,529 5,422
LIABILITIES
Purchased intangible assets ............................................... (997) (1,224)
Depreciation ........................................................... (298) (120)
Unrealized gains on investments ........................................... (265) (185)
Other ................................................................. (90) (51)
Total deferred tax liabilities ........................................... (1,650) (1,580)
Total net deferred tax assets ....................................... $ 3,879 $ 3,842
As of July 30, 2011, the Company’s federal, state, and foreign net operating loss carryforwards for income tax
purposes were $334 million, $1.7 billion, and $298 million, respectively. If not utilized, the federal net operating
loss carryforwards will begin to expire in fiscal 2019, the state net operating loss carryforwards will begin to
expire in fiscal 2012, and the foreign net operating loss carryforwards will begin to expire in fiscal 2012. As of
July 30, 2011, the Company’s federal and state tax credit carryforwards for income tax purposes were
approximately $5 million and $531 million, respectively. If not utilized, the federal and state tax credit
carryforwards will begin to expire in fiscal 2013 and fiscal 2012, respectively.
16. Segment Information and Major Customers
The Company designs, manufactures, and sells Internet Protocol (IP)-based networking and other products
related to the communications and IT industry and provides services associated with these products and their use.
Cisco product categories consist of Routers, Switches, New Products, and Other Products. These products,
primarily integrated by Cisco IOS Software, link geographically dispersed local-area networks (LANs),
metropolitan-area networks (MANs) and wide-area networks (WANs).
(a) Net Sales and Gross Margin by Segment
The Company conducts business globally and is primarily managed on a geographic basis. As of July 30, 2011,
the Company had four geographic segments, which consisted of United States and Canada, European Markets,
Emerging Markets, and Asia Pacific Markets, as presented in the following tables. As the Company strives for
faster decision making with greater accountability and alignment to support the Company’s emerging countries
and the five foundational priorities as discussed in Note 5, beginning in fiscal 2012, the Company will organize
into the following three geographic segments: The Americas; Europe, Middle East, and Africa (“EMEA”); and
Asia Pacific, Japan, and China (“APJC”).
The Company’s management makes financial decisions and allocates resources based on the information it
receives from its internal management system. Sales are attributed to a geographic segment based on the ordering
127