Cisco 2011 Annual Report Download - page 109
Download and view the complete annual report
Please find page 109 of the 2011 Cisco annual report below. You can navigate through the pages in the report by either clicking on the pages listed below, or by using the keyword search tool below to find specific information within the annual report.-
 1
1 -
2
-
3
-
4
-
5
-
6
-
7
-
8
-
9
-
10
-
11
-
12
-
13
-
14
-
15
-
16
-
17
-
18
-
19
-
20
-
21
-
22
-
23
-
24
-
25
-
26
-
27
-
28
-
29
-
30
-
31
-
32
-
33
-
34
-
35
-
36
-
37
-
38
-
39
-
40
-
41
-
42
-
43
-
44
-
45
-
46
-
47
-
48
-
49
-
50
-
51
-
52
-
53
-
54
-
55
-
56
-
57
-
58
-
59
-
60
-
61
-
62
-
63
-
64
-
65
-
66
-
67
-
68
-
69
-
70
-
71
-
72
-
73
-
74
-
75
-
76
-
77
-
78
-
79
-
80
-
81
-
82
-
83
-
84
-
85
-
86
-
87
-
88
-
89
-
90
-
91
-
92
-
93
-
94
-
95
-
96
-
97
-
98
-
 99
99 -
 100
100 -
 101
101 -
 102
102 -
 103
103 -
 104
104 -
 105
105 -
 106
106 -
 107
107 -
 108
108 -
 109
109 -
 110
110 -
 111
111 -
 112
112 -
 113
113 -
 114
114 -
 115
115 -
 116
116 -
 117
117 -
 118
118 -
 119
119 -
120
-
121
-
122
-
123
-
124
-
125
-
126
-
127
-
128
-
129
-
130
-
131
-
132
-
133
-
134
-
135
-
136
-
137
-
138
-
139
-
140
-
141
-
142
-
143
-
144
-
145
-
146
-
147
-
148
-
149
-
150
-
151
-
152
 |
 |

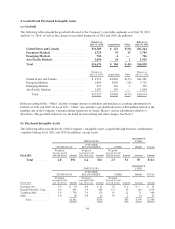
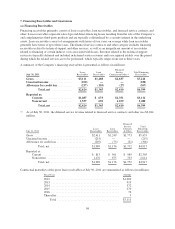
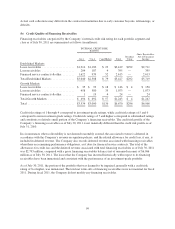
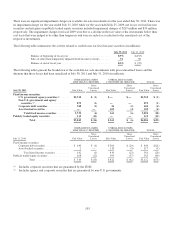
(c) Allowance for Credit Loss Rollforward
The activity for fiscal 2011 related to the allowances for credit loss and the related financing receivables as of
July 30, 2011 are summarized as follows (in millions):
CREDIT LOSS ALLOWANCES
Lease
Receivables
Loan
Receivables
Financed Service
Contracts & Other Total
Allowance for credit loss as of July 31, 2010 ................ $ 207 $ 73 $ 21 $ 301
Provisions ............................................ 31 43 8 82
Write-offs, net ........................................ (13) (18) (2) (33)
Foreign exchange and other .............................. 12 5 — 17
Allowance for credit loss as of July 30, 2011 ................ $ 237 $ 103 $ 27 $ 367
Gross receivables as of July 30, 2011, net of unearned income ....
$2,861 $1,468 $2,637 $6,966
Financing receivables that were individually evaluated for impairment during fiscal 2011 were not material and
therefore are not presented separately in the preceding table.
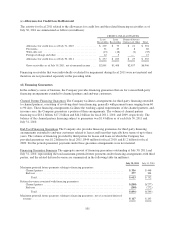
(d) Financing Guarantees
In the ordinary course of business, the Company provides financing guarantees that are for various third-party
financing arrangements extended to channel partners and end-user customers.
Channel Partner Financing Guarantees The Company facilitates arrangements for third-party financing extended
to channel partners, consisting of revolving short-term financing, generally with payment terms ranging from 60
to 90 days. These financing arrangements facilitate the working capital requirements of the channel partners, and,
in some cases, the Company guarantees a portion of these arrangements. The volume of channel partner
financing was $18.2 billion, $17.2 billion and $14.2 billion for fiscal 2011, 2010, and 2009, respectively. The
balance of the channel partner financing subject to guarantees was $1.4 billion as of each July 30, 2011 and
July 31, 2010.
End-User Financing Guarantees The Company also provides financing guarantees for third-party financing
arrangements extended to end-user customers related to leases and loans that typically have terms of up to three
years. The volume of financing provided by third parties for leases and loans on which the Company has
provided guarantees was $1.2 billion for fiscal 2011, $944 million for fiscal 2010, and $1.2 billion for fiscal
2009. For the periods presented, payments under these guarantee arrangements were not material.
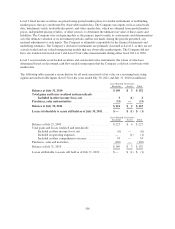
Financing Guarantee Summary The aggregate amount of financing guarantees outstanding at July 30, 2011 and
July 31, 2010, representing the total maximum potential future payments under financing arrangements with third
parties, and the related deferred revenue are summarized in the following table (in millions):
July 30, 2011 July 31, 2010
Maximum potential future payments relating to financing guarantees:
Channel partner ............................................................ $ 336 $ 448
End user .................................................................. 277 304
Total ................................................................. $ 613 $ 752
Deferred revenue associated with financing guarantees:
Channel partner ............................................................ $(248) $(277)
End user .................................................................. (248) (272)
Total ................................................................. $(496) $(549)
Maximum potential future payments relating to financing guarantees, net of associated deferred
revenue ..................................................................... $ 117 $ 203
101