Cisco 2011 Annual Report Download - page 63
Download and view the complete annual report
Please find page 63 of the 2011 Cisco annual report below. You can navigate through the pages in the report by either clicking on the pages listed below, or by using the keyword search tool below to find specific information within the annual report.-
 1
1 -
2
-
3
-
4
-
5
-
6
-
7
-
8
-
9
-
10
-
11
-
12
-
13
-
14
-
15
-
16
-
17
-
18
-
19
-
20
-
21
-
22
-
23
-
24
-
25
-
26
-
27
-
28
-
29
-
30
-
31
-
32
-
33
-
34
-
35
-
36
-
37
-
38
-
39
-
40
-
41
-
42
-
43
-
44
-
45
-
46
-
47
-
48
-
49
-
50
-
51
-
52
-
 53
53 -
 54
54 -
 55
55 -
 56
56 -
 57
57 -
 58
58 -
 59
59 -
 60
60 -
 61
61 -
 62
62 -
 63
63 -
 64
64 -
 65
65 -
 66
66 -
 67
67 -
 68
68 -
 69
69 -
 70
70 -
 71
71 -
 72
72 -
 73
73 -
74
-
75
-
76
-
77
-
78
-
79
-
80
-
81
-
82
-
83
-
84
-
85
-
86
-
87
-
88
-
89
-
90
-
91
-
92
-
93
-
94
-
95
-
96
-
97
-
98
-
99
-
100
-
101
-
102
-
103
-
104
-
105
-
106
-
107
-
108
-
109
-
110
-
111
-
112
-
113
-
114
-
115
-
116
-
117
-
118
-
119
-
120
-
121
-
122
-
123
-
124
-
125
-
126
-
127
-
128
-
129
-
130
-
131
-
132
-
133
-
134
-
135
-
136
-
137
-
138
-
139
-
140
-
141
-
142
-
143
-
144
-
145
-
146
-
147
-
148
-
149
-
150
-
151
-
152
 |
 |

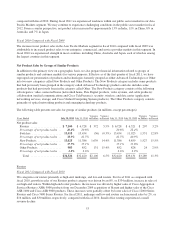
55%, respectively, were offset by a sales decline in video systems of 1%. The increased sales of service
provider video products were partially offset by lower sales of virtual home products, due to a decline
of 26% in sales of networked home products and due to an 11% decline in sales of Flip Video cameras,
attributable to our exit of the video camera business in the third quarter of fiscal 2011.
• Sales of security products decreased by 8%, or $143 million. Our decreased sales of security products
were the result of lower sales of module and line cards related to our routers and LAN switches,
partially offset by increased sales of our web and email security products.
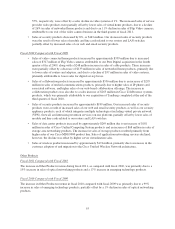
Fiscal 2010 Compared with Fiscal 2009
• Sales of video connected home products increased by approximately $359 million due to increased
sales of $317 million of Flip Video cameras attributable to our Pure Digital acquisition in the fourth
quarter of fiscal 2009, along with a $248 million increase in sales of cable products. These increases
were partially offset by a decrease of $133 million in sales of networked home products, primarily due
to lower sales of routers and adapters, and due to a decline of $57 million in sales of video systems,
primarily attributable to lower sales for digital set-top boxes.
• Sales of collaboration products increased by approximately $556 million due to an increase of $293
million in sales of unified communications products, primarily due to higher sales of IP phones and
associated software, and higher sales of our web-based collaboration offerings. The increase in
collaboration products was also due to a sales increase of $263 million in Cisco TelePresence systems
products, which was primarily attributable to our acquisition of Tandberg completed at the end of the
third quarter of fiscal 2010.
• Sales of security products increased by approximately $189 million. Our increased sales of security
products were a result of increased sales of our web and email security products as well as our security
appliance products, each of which integrates multiple technologies (including virtual private network
(VPN), firewall, and intrusion-prevention services) on one platform, partially offset by lower sales of
module and line-cards related to our routers and LAN switches.
• Sales of data center products increased by approximately $249 million due to an increase of $181
million in sales of Cisco Unified Computing System products and an increase of $68 million in sales of
storage area networking products. The increase in sales of storage products resulted primarily from
higher sales of our Cisco MDS 9000 product line. Sales of application networking services declined;
however, the decline was offset by higher server virtualization sales.
• Sales of wireless products increased by approximately $174 million, primarily due to increases in the
customer adoption of and migration to the Cisco Unified Wireless Network architecture.
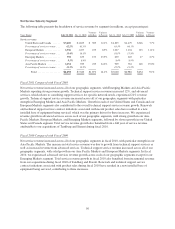
Other Products
Fiscal 2011 Compared with Fiscal 2010
The increase in Other Product revenue during fiscal 2011, as compared with fiscal 2010, was primarily due to a
19% increase in sales of optical networking products and a 17% increase in emerging technology products.
Fiscal 2010 Compared with Fiscal 2009
The increase in Other Products revenue in fiscal 2010 compared with fiscal 2009 was primarily due to a 99%
increase in sales of emerging technology products, partially offset by a 1% decline in sales of optical networking
products.
55