Cisco 2011 Annual Report Download - page 70
Download and view the complete annual report
Please find page 70 of the 2011 Cisco annual report below. You can navigate through the pages in the report by either clicking on the pages listed below, or by using the keyword search tool below to find specific information within the annual report.-
 1
1 -
2
-
3
-
4
-
5
-
6
-
7
-
8
-
9
-
10
-
11
-
12
-
13
-
14
-
15
-
16
-
17
-
18
-
19
-
20
-
21
-
22
-
23
-
24
-
25
-
26
-
27
-
28
-
29
-
30
-
31
-
32
-
33
-
34
-
35
-
36
-
37
-
38
-
39
-
40
-
41
-
42
-
43
-
44
-
45
-
46
-
47
-
48
-
49
-
50
-
51
-
52
-
53
-
54
-
55
-
56
-
57
-
58
-
59
-
 60
60 -
 61
61 -
 62
62 -
 63
63 -
 64
64 -
 65
65 -
 66
66 -
 67
67 -
 68
68 -
 69
69 -
 70
70 -
 71
71 -
 72
72 -
 73
73 -
 74
74 -
 75
75 -
 76
76 -
 77
77 -
 78
78 -
 79
79 -
 80
80 -
81
-
82
-
83
-
84
-
85
-
86
-
87
-
88
-
89
-
90
-
91
-
92
-
93
-
94
-
95
-
96
-
97
-
98
-
99
-
100
-
101
-
102
-
103
-
104
-
105
-
106
-
107
-
108
-
109
-
110
-
111
-
112
-
113
-
114
-
115
-
116
-
117
-
118
-
119
-
120
-
121
-
122
-
123
-
124
-
125
-
126
-
127
-
128
-
129
-
130
-
131
-
132
-
133
-
134
-
135
-
136
-
137
-
138
-
139
-
140
-
141
-
142
-
143
-
144
-
145
-
146
-
147
-
148
-
149
-
150
-
151
-
152
 |
 |

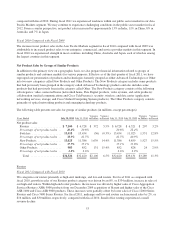
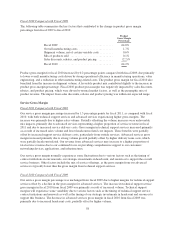
Fiscal 2010 Compared with Fiscal 2009
Sales and marketing expenses increased in fiscal 2010 compared with fiscal 2009 due to an increase of $222
million in sales expenses and an increase of $116 million in marketing expenses. Both the sales expense and the
marketing expense components of the category increased during fiscal 2010 due to higher headcount-related
expenses, including higher variable compensation expense, higher share-based compensation expense, and the
impact of the extra week in fiscal 2010.
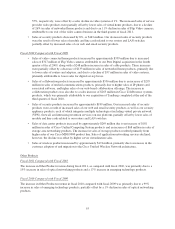
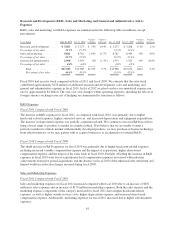
G&A Expenses
Fiscal 2011 Compared with Fiscal 2010
The decrease in G&A expenses in fiscal 2011, as compared with fiscal 2010, was due to lower real estate-related
charges in fiscal 2011 and the absence of non-income tax-related expenses (such as fees and licenses), which
were included in fiscal 2010. Partially offsetting these items were higher headcount-related expenses, higher
outside services costs for operational support areas, and increased equipment, depreciation, and rent expenses.
Fiscal 2010 Compared with Fiscal 2009
The increase in G&A expenses in fiscal 2010, compared with fiscal 2009 was in part attributable to
approximately $130 million of higher real estate-related charges related to impairments and other charges related
to excess facilities. Additionally, G&A expenses in fiscal 2010 increased due to higher share-based compensation
expense, higher headcount-related expenses, acquisition-related expenses, and higher information technology
expenses, as well as the impact of the extra week in fiscal 2010.
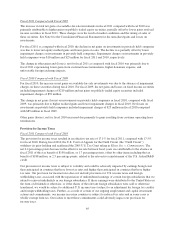
Effect of Foreign Currency
In fiscal 2011, foreign currency fluctuations, net of hedging, increased the combined R&D, sales and marketing,
and G&A expenses by $53 million, or approximately 0.3%, compared with fiscal 2010. In fiscal 2010, foreign
currency fluctuations, net of hedging, increased the combined R&D, sales and marketing, and G&A expenses by
$34 million, or approximately 0.2%, compared with fiscal 2009.
Headcount
Fiscal 2011 Compared with Fiscal 2010
For fiscal 2011, our headcount increased by 1,111 employees, the increase being attributable to targeted hiring as
part of our investment in growth initiatives, partially offset by the impacts of our voluntary early retirement
program and our restructuring activities, which began to reduce our headcount in late fiscal 2011. We expect our
headcount to decrease in the near term as part of targeted cost-cutting initiatives, which include the workforce
reduction announced in July 2011. Additionally, we also expect our headcount in fiscal 2012 to decrease by
approximately 5,000 employees upon the planned completion in fiscal 2012 of the sale of our Juarez, Mexico
manufacturing operations.
Fiscal 2010 Compared with Fiscal 2009
For fiscal 2010, our headcount increased by approximately 5,150 employees, which was attributable to the
acquisitions of Tandberg and Starent along with targeted hiring as part of our investment in growth initiatives.
62