Cisco 2011 Annual Report Download - page 111
Download and view the complete annual report
Please find page 111 of the 2011 Cisco annual report below. You can navigate through the pages in the report by either clicking on the pages listed below, or by using the keyword search tool below to find specific information within the annual report.-
 1
1 -
2
-
3
-
4
-
5
-
6
-
7
-
8
-
9
-
10
-
11
-
12
-
13
-
14
-
15
-
16
-
17
-
18
-
19
-
20
-
21
-
22
-
23
-
24
-
25
-
26
-
27
-
28
-
29
-
30
-
31
-
32
-
33
-
34
-
35
-
36
-
37
-
38
-
39
-
40
-
41
-
42
-
43
-
44
-
45
-
46
-
47
-
48
-
49
-
50
-
51
-
52
-
53
-
54
-
55
-
56
-
57
-
58
-
59
-
60
-
61
-
62
-
63
-
64
-
65
-
66
-
67
-
68
-
69
-
70
-
71
-
72
-
73
-
74
-
75
-
76
-
77
-
78
-
79
-
80
-
81
-
82
-
83
-
84
-
85
-
86
-
87
-
88
-
89
-
90
-
91
-
92
-
93
-
94
-
95
-
96
-
97
-
98
-
99
-
100
-
 101
101 -
 102
102 -
 103
103 -
 104
104 -
 105
105 -
 106
106 -
 107
107 -
 108
108 -
 109
109 -
 110
110 -
 111
111 -
 112
112 -
 113
113 -
 114
114 -
 115
115 -
 116
116 -
 117
117 -
 118
118 -
 119
119 -
 120
120 -
 121
121 -
122
-
123
-
124
-
125
-
126
-
127
-
128
-
129
-
130
-
131
-
132
-
133
-
134
-
135
-
136
-
137
-
138
-
139
-
140
-
141
-
142
-
143
-
144
-
145
-
146
-
147
-
148
-
149
-
150
-
151
-
152
 |
 |

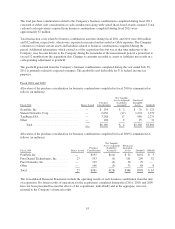
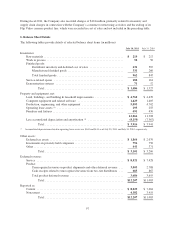
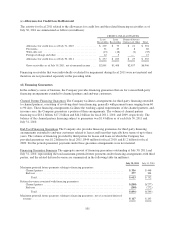
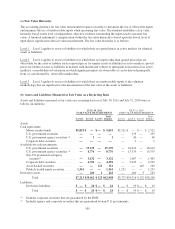
There were no significant impairment charges on available-for-sale investments for the year ended July 30, 2011. There was
no impairment charge for the year ended July 31, 2010 while for the year ended July 25, 2009, net losses on fixed income
securities and net gains on publicly traded equity securities included impairment charges of $219 million and $39 million,
respectively. The impairment charges for fiscal 2009 were due to a decline in the fair value of the investments below their
cost basis that were judged to be other than temporary and were recorded as a reduction to the amortized cost of the
respective investments.
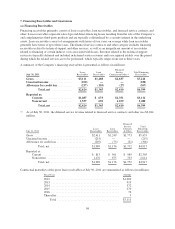
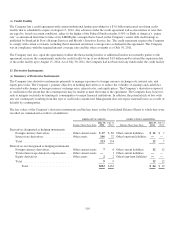
The following table summarizes the activity related to credit losses for fixed income securities (in millions):
July 30, 2011 July 31, 2010
Balance at beginning of fiscal year ............................... $(95) $(153)
Sales of other-than-temporarily impaired fixed income securities ....... 72 58
Balance at end of fiscal year .................................... $(23) $ (95)
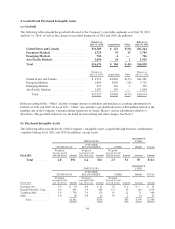
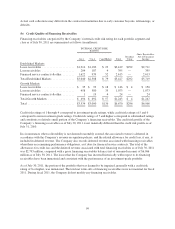
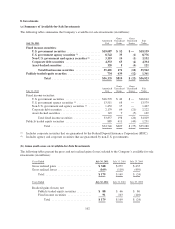
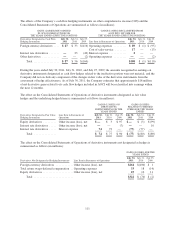
The following tables present the breakdown of the available-for-sale investments with gross unrealized losses and the
duration that those losses had been unrealized at July 30, 2011 and July 31, 2010 (in millions):
UNREALIZED LOSSES
LESS THAN 12 MONTHS
UNREALIZED LOSSES
12 MONTHS OR GREATER TOTAL
July 30, 2011 Fair Value
Gross
Unrealized
Losses Fair Value
Gross
Unrealized
Losses Fair Value
Gross
Unrealized
Losses
Fixed income securities:
U.S. government agency securities (1) ....... $2,310 $ (1) $ — $ — $2,310 $ (1)
Non-U.S. government and agency
securities (2) .......................... 875 (1) — — 875 (1)
Corporate debt securities ................ 548 (2) 56 (2) 604 (4)
Asset-backed securities .................. — — 105 (4) 105 (4)
Total fixed income securities ......... 3,733 (4) 161 (6) 3,894 (10)
Publicly traded equity securities .............. 112 (12) — — 112 (12)
Total ......................... $3,845 $ (16) $ 161 $ (6) $4,006 $(22)
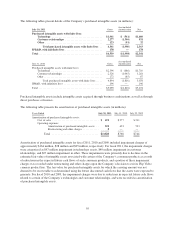
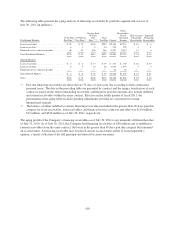
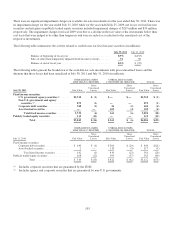
UNREALIZED LOSSES
LESS THAN 12 MONTHS
UNREALIZED LOSSES
12 MONTHS OR GREATER TOTAL
July 31, 2010 Fair Value
Gross
Unrealized
Losses Fair Value
Gross
Unrealized
Losses Fair Value
Gross
Unrealized
Losses
Fixed income securities:
Corporate debt securities .................. $ 140 $ (1) $304 $ (20) $ 444 $(21)
Asset-backed securities ................... 2 — 115 (5) 117 (5)
Total fixed income securities .......... 142 (1) 419 (25) 561 (26)
Publicly traded equity securities ................ 168 (12) 393 (37) 561 (49)
Total ......................... $ 310 $(13) $ 812 $ (62) $1,122 $(75)
(1) Includes corporate securities that are guaranteed by the FDIC.
(2) Includes agency and corporate securities that are guaranteed by non-U.S. governments.
103