Cisco 2011 Annual Report Download - page 52
Download and view the complete annual report
Please find page 52 of the 2011 Cisco annual report below. You can navigate through the pages in the report by either clicking on the pages listed below, or by using the keyword search tool below to find specific information within the annual report.-
 1
1 -
2
-
3
-
4
-
5
-
6
-
7
-
8
-
9
-
10
-
11
-
12
-
13
-
14
-
15
-
16
-
17
-
18
-
19
-
20
-
21
-
22
-
23
-
24
-
25
-
26
-
27
-
28
-
29
-
30
-
31
-
32
-
33
-
34
-
35
-
36
-
37
-
38
-
39
-
40
-
41
-
 42
42 -
 43
43 -
 44
44 -
 45
45 -
 46
46 -
 47
47 -
 48
48 -
 49
49 -
 50
50 -
 51
51 -
 52
52 -
 53
53 -
 54
54 -
 55
55 -
 56
56 -
 57
57 -
 58
58 -
 59
59 -
 60
60 -
 61
61 -
 62
62 -
63
-
64
-
65
-
66
-
67
-
68
-
69
-
70
-
71
-
72
-
73
-
74
-
75
-
76
-
77
-
78
-
79
-
80
-
81
-
82
-
83
-
84
-
85
-
86
-
87
-
88
-
89
-
90
-
91
-
92
-
93
-
94
-
95
-
96
-
97
-
98
-
99
-
100
-
101
-
102
-
103
-
104
-
105
-
106
-
107
-
108
-
109
-
110
-
111
-
112
-
113
-
114
-
115
-
116
-
117
-
118
-
119
-
120
-
121
-
122
-
123
-
124
-
125
-
126
-
127
-
128
-
129
-
130
-
131
-
132
-
133
-
134
-
135
-
136
-
137
-
138
-
139
-
140
-
141
-
142
-
143
-
144
-
145
-
146
-
147
-
148
-
149
-
150
-
151
-
152
 |
 |

recognized ratably over the period during which the services are to be performed, which typically is from one to
three years. Advanced services revenue is recognized upon delivery or completion of performance. Our deferred
revenue for services was $8.5 billion and $7.4 billion as of July 30, 2011 and July 31, 2010, respectively.
We make sales to distributors and retail partners and generally recognize revenue based on a sell-through method
using information provided by them. Our distributors and retail partners participate in various cooperative
marketing and other programs, and we maintain estimated accruals and allowances for these programs. If actual
credits received by our distributors and retail partners under these programs were to deviate significantly from
our estimates, which are based on historical experience, our revenue could be adversely affected.
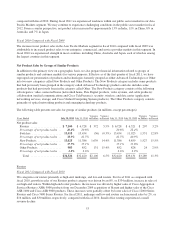
Allowances for Receivables and Sales Returns
The allowances for receivables were as follows (in millions, except percentages):
July 30, 2011 July 31, 2010
Allowance for doubtful accounts ................. $204 $235
Percentage of gross accounts receivable ........... 4.2% 4.6%
Allowance for credit loss—lease receivables ....... $237 $207
Percentage of gross lease receivables ............. 7.6% 8.6%
Allowance for credit loss—loan receivables ........ $103 $73
Percentage of gross loan receivables ............. 7.0% 5.8%
The allowances are based on our assessment of the collectibility of customer accounts. We regularly review the
adequacy of these allowances by considering internal factors such as historical experience, credit quality and age
of the receivable balances as well as external factors such as economic conditions that may affect a customer’s
ability to pay, historical default rates, and long-term historical loss rates published by major third-party credit-
rating agencies. We also consider the concentration of receivables outstanding with a particular customer in
assessing the adequacy of our allowances. In addition, we evaluate the credit quality of our financing receivables
and any associated allowance for credit loss by applying the relevant loss factors based on our internal credit risk
rating for the respective financing receivables, disaggregated by segment and class. See Note 7 to the
Consolidated Financial Statements. Determination of loss factors associated with internal credit risk ratings is
complex and subjective. Our ongoing consideration of all these factors could result in an increase in our
allowance for credit loss in the future, which could adversely affect our net income. Similarly, if a major
customer’s creditworthiness deteriorates, if actual defaults are higher than our historical experience, or if other
circumstances arise, our estimates of the recoverability of amounts due to us could be overstated, and additional
allowances could be required, which could have an adverse impact on our revenue.
Both accounts receivable and financing receivables are charged off at the point when they are considered
uncollectible. The decline in our allowance for doubtful accounts as a percentage of our gross accounts
receivable was primarily due to the charge-off of certain uncollectible receivables that had been fully reserved.
A reserve for future sales returns is established based on historical trends in product return rates. The reserve for
future sales returns as of July 30, 2011 and July 31, 2010 was $106 million and $90 million, respectively, and
was recorded as a reduction of our accounts receivable. If the actual future returns were to deviate from the
historical data on which the reserve had been established, our revenue could be adversely affected.
Inventory Valuation and Liability for Purchase Commitments with Contract Manufacturers and
Suppliers
Our inventory balance was $1.5 billion and $1.3 billion as of July 30, 2011 and July 31, 2010, respectively.
Inventory is written down based on excess and obsolete inventories determined primarily by future demand
forecasts. Inventory write-downs are measured as the difference between the cost of the inventory and market,
based upon assumptions about future demand, and are charged to the provision for inventory, which is a
44