Cisco 2011 Annual Report Download - page 136
Download and view the complete annual report
Please find page 136 of the 2011 Cisco annual report below. You can navigate through the pages in the report by either clicking on the pages listed below, or by using the keyword search tool below to find specific information within the annual report.-
 1
1 -
2
-
3
-
4
-
5
-
6
-
7
-
8
-
9
-
10
-
11
-
12
-
13
-
14
-
15
-
16
-
17
-
18
-
19
-
20
-
21
-
22
-
23
-
24
-
25
-
26
-
27
-
28
-
29
-
30
-
31
-
32
-
33
-
34
-
35
-
36
-
37
-
38
-
39
-
40
-
41
-
42
-
43
-
44
-
45
-
46
-
47
-
48
-
49
-
50
-
51
-
52
-
53
-
54
-
55
-
56
-
57
-
58
-
59
-
60
-
61
-
62
-
63
-
64
-
65
-
66
-
67
-
68
-
69
-
70
-
71
-
72
-
73
-
74
-
75
-
76
-
77
-
78
-
79
-
80
-
81
-
82
-
83
-
84
-
85
-
86
-
87
-
88
-
89
-
90
-
91
-
92
-
93
-
94
-
95
-
96
-
97
-
98
-
99
-
100
-
101
-
102
-
103
-
104
-
105
-
106
-
107
-
108
-
109
-
110
-
111
-
112
-
113
-
114
-
115
-
116
-
117
-
118
-
119
-
120
-
121
-
122
-
123
-
124
-
125
-
 126
126 -
 127
127 -
 128
128 -
 129
129 -
 130
130 -
 131
131 -
 132
132 -
 133
133 -
 134
134 -
 135
135 -
 136
136 -
 137
137 -
 138
138 -
 139
139 -
 140
140 -
 141
141 -
 142
142 -
 143
143 -
 144
144 -
 145
145 -
 146
146 -
147
-
148
-
149
-
150
-
151
-
152
 |
 |

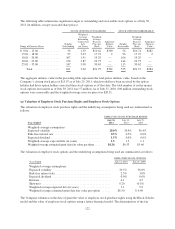
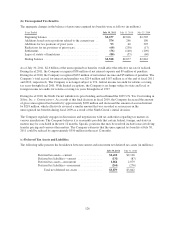
location of the customer. The Company does not allocate research and development, sales and marketing, or
general and administrative expenses to its geographic segments in this internal management system because
management does not include the information in its measurement of the performance of the operating segments.
In addition, the Company does not allocate amortization of acquisition-related intangible assets, share-based
compensation expense, charges related to asset impairments and restructurings, and certain other charges to the
gross margin for each segment because management does not include this information in its measurement of the
performance of the operating segments.
Summarized financial information by segment for fiscal 2011, 2010, and 2009, based on the Company’s internal
management system and as utilized by the Company’s Chief Operating Decision Maker (CODM), is as follows
(in millions):
Years Ended July 30, 2011 July 31, 2010 July 25, 2009
Net sales:
United States and Canada (1) ............. $23,115 $21,740 $19,345
European Markets ..................... 8,536 8,048 7,683
Emerging Markets .................... 4,966 4,367 3,999
Asia Pacific Markets ................... 6,601 5,885 5,090
Total ........................... $43,218 $40,040 $36,117
Gross margin:
United States and Canada ............... $14,618 $14,042 $12,660
European Markets ..................... 5,529 5,425 5,116
Emerging Markets .................... 3,067 2,805 2,438
Asia Pacific Markets ................... 4,147 3,847 3,272
Segment total .................... 27,361 26,119 23,486
Unallocated corporate items (2) ............... (825) (476) (392)
Total ........................... $26,536 $25,643 $23,094
(1) Net sales in the United States were $21.5 billion, $20.4 billion, and $18.2 billion for fiscal 2011, 2010, and
2009, respectively.
(2) The unallocated corporate items include the effects of amortization and impairment of acquisition-related
intangible assets, share-based compensation expense, and charges related to asset impairments and
restructurings.
(b) Net Sales for Groups of Similar Products and Services
The following table presents net sales for groups of similar products and services (in millions):
Years Ended July 30, 2011 July 31, 2010 July 25, 2009
Net sales:
Routers ............................. $ 7,100 $ 6,728 $ 6,521
Switches ............................ 13,418 13,454 11,923
New Products ........................ 13,025 11,386 9,859
Other Products ....................... 983 852 828
Product ......................... 34,526 32,420 29,131
Service ......................... 8,692 7,620 6,986
Total ....................... $43,218 $40,040 $36,117
The New Products category consists of products related to collaboration, data center, security, wireless, and
video connected home. The Other category consists primarily of optical networking products and emerging
technologies.
128