Cisco 2011 Annual Report Download - page 62
Download and view the complete annual report
Please find page 62 of the 2011 Cisco annual report below. You can navigate through the pages in the report by either clicking on the pages listed below, or by using the keyword search tool below to find specific information within the annual report.-
 1
1 -
2
-
3
-
4
-
5
-
6
-
7
-
8
-
9
-
10
-
11
-
12
-
13
-
14
-
15
-
16
-
17
-
18
-
19
-
20
-
21
-
22
-
23
-
24
-
25
-
26
-
27
-
28
-
29
-
30
-
31
-
32
-
33
-
34
-
35
-
36
-
37
-
38
-
39
-
40
-
41
-
42
-
43
-
44
-
45
-
46
-
47
-
48
-
49
-
50
-
51
-
 52
52 -
 53
53 -
 54
54 -
 55
55 -
 56
56 -
 57
57 -
 58
58 -
 59
59 -
 60
60 -
 61
61 -
 62
62 -
 63
63 -
 64
64 -
 65
65 -
 66
66 -
 67
67 -
 68
68 -
 69
69 -
 70
70 -
 71
71 -
 72
72 -
73
-
74
-
75
-
76
-
77
-
78
-
79
-
80
-
81
-
82
-
83
-
84
-
85
-
86
-
87
-
88
-
89
-
90
-
91
-
92
-
93
-
94
-
95
-
96
-
97
-
98
-
99
-
100
-
101
-
102
-
103
-
104
-
105
-
106
-
107
-
108
-
109
-
110
-
111
-
112
-
113
-
114
-
115
-
116
-
117
-
118
-
119
-
120
-
121
-
122
-
123
-
124
-
125
-
126
-
127
-
128
-
129
-
130
-
131
-
132
-
133
-
134
-
135
-
136
-
137
-
138
-
139
-
140
-
141
-
142
-
143
-
144
-
145
-
146
-
147
-
148
-
149
-
150
-
151
-
152
 |
 |

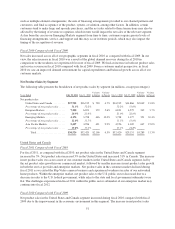
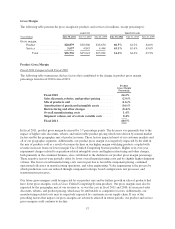
Fiscal 2010 Compared with Fiscal 2009
Our sales of routers increased in our high-end category in fiscal 2010 by 10%, or $409 million, while sales of
routers declined in both the midrange and low-end categories by 11% and 5%, respectively. Within the high-end
router category, the increase was driven by higher sales of the Cisco CRS-1 Carrier Routing System, Cisco 7600
Series Routers, and Cisco ASR 1000 and 9000 products, and the inclusion of the Cisco ASR 5000 products from
our acquisition of Starent, partially offset by lower sales of Cisco 12000 Series Routers. Our decline in sales of
midrange and low-end routers was primarily due to a decline in sales of our integrated services routers.
Switches
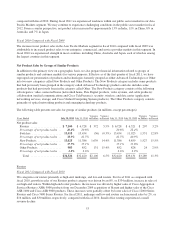
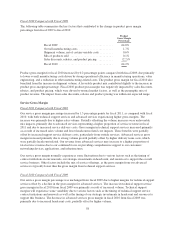
Fiscal 2011 Compared with Fiscal 2010
Net product sales in our Switches product category were relatively flat in fiscal 2011 compared with fiscal 2010,
which was due to the combined effect of continuing transitions taking place in our product portfolio, lower public
sector spending, and the impact of increased competitive pressures. Since approximately 25% of our switching
business is derived from sales to the public sector, reductions in public sector spending in developed markets
around the world could continue to present challenges for our switching sales performance. Within our Switches
product category, higher sales of LAN fixed-configuration switches partially offset lower sales of modular
switches. Sales of LAN fixed-configuration switches increased 3%, or $240 million, while sales of modular
switches decreased 4%, or $275 million. The increase in LAN fixed-configuration switches was primarily due to
increased sales of Cisco Catalyst 2960 Series Switches and Cisco Nexus 2000 and 5000 Series Switches, partially
offset by decreased sales of Cisco Catalyst 3560 and 3750 Series Switches. The decrease in sales of modular
switches was primarily due to decreased sales of Cisco Catalyst 6500 Series Switches, partially offset by
increased sales of Cisco Nexus 7000 and Cisco Catalyst 4500 Series Switches.
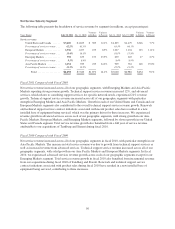
Fiscal 2010 Compared with Fiscal 2009
The increase in net product sales related to switches in fiscal 2010 compared with fiscal 2009 was due primarily
to higher sales of our modular and LAN fixed-configuration switches of approximately $882 million and $649
million, respectively. The increase in sales of modular switches was primarily due to the increased sales of our
Cisco Nexus 7000 and Cisco Catalyst 4500 Series Switches, partially offset by decreased sales of our Cisco
Catalyst 6000 Series Switches. The increase in LAN fixed-configuration switches was primarily due to increased
sales of Cisco Catalyst 2960 Series Switches and Cisco Nexus 5000 and 2000 Series Switches, partially offset by
decreased sales of our Cisco Catalyst 3560 Series Switches.
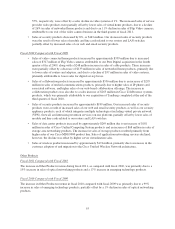
New Products
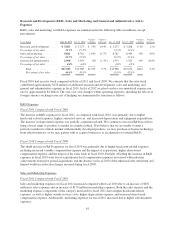
Fiscal 2011 Compared with Fiscal 2010
• Sales of collaboration products increased by 31%, or $972 million, primarily due to the inclusion of
Tandberg sales within our Cisco TelePresence systems product line following our fiscal 2010 third
quarter acquisition of Tandberg, and a 4% increase in sales of unified communications products,
primarily IP phones and collaborative web-based offerings.
• Sales of data center products increased by 44%, or $491 million, due to sales growth of over 273%, or
$496 million, of Cisco Unified Computing System products and due to storage sales growth of 9%, or
$43 million, attributable to increased sales of our Cisco MDS 9000 product line. These increases were
partially offset by a 12% decline in sales of application networking services products.
• Sales of wireless products increased by 26%, or $303 million, which was primarily due to continued
customer adoption of and migration to the Cisco Unified Wireless Network architecture.
• Sales of video connected home products were relatively flat. Sales of service provider video products
increased by 6%, or $208 million, as increased sales of cable and cable modem products of 18% and
54