Cisco 2011 Annual Report Download - page 116
Download and view the complete annual report
Please find page 116 of the 2011 Cisco annual report below. You can navigate through the pages in the report by either clicking on the pages listed below, or by using the keyword search tool below to find specific information within the annual report.-
 1
1 -
2
-
3
-
4
-
5
-
6
-
7
-
8
-
9
-
10
-
11
-
12
-
13
-
14
-
15
-
16
-
17
-
18
-
19
-
20
-
21
-
22
-
23
-
24
-
25
-
26
-
27
-
28
-
29
-
30
-
31
-
32
-
33
-
34
-
35
-
36
-
37
-
38
-
39
-
40
-
41
-
42
-
43
-
44
-
45
-
46
-
47
-
48
-
49
-
50
-
51
-
52
-
53
-
54
-
55
-
56
-
57
-
58
-
59
-
60
-
61
-
62
-
63
-
64
-
65
-
66
-
67
-
68
-
69
-
70
-
71
-
72
-
73
-
74
-
75
-
76
-
77
-
78
-
79
-
80
-
81
-
82
-
83
-
84
-
85
-
86
-
87
-
88
-
89
-
90
-
91
-
92
-
93
-
94
-
95
-
96
-
97
-
98
-
99
-
100
-
101
-
102
-
103
-
104
-
105
-
 106
106 -
 107
107 -
 108
108 -
 109
109 -
 110
110 -
 111
111 -
 112
112 -
 113
113 -
 114
114 -
 115
115 -
 116
116 -
 117
117 -
 118
118 -
 119
119 -
 120
120 -
 121
121 -
 122
122 -
 123
123 -
 124
124 -
 125
125 -
 126
126 -
127
-
128
-
129
-
130
-
131
-
132
-
133
-
134
-
135
-
136
-
137
-
138
-
139
-
140
-
141
-
142
-
143
-
144
-
145
-
146
-
147
-
148
-
149
-
150
-
151
-
152
 |
 |

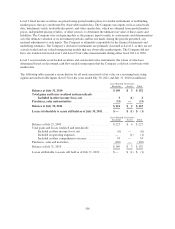
The loss related to the manufacturing operations held for sale was primarily related to a reduction in goodwill
related to the pending sale of the Company’s set-top box manufacturing operations in Juarez, Mexico. See
Note 5. This goodwill reduction represents the difference between the carrying value and the implied fair value
of the goodwill associated with the disposal group being evaluated.
(d) Other
The fair value of certain of the Company’s financial instruments that are not measured at fair value, including
accounts receivable, accounts payable, accrued compensation and other current liabilities, approximates the
carrying amount because of their short maturities. In addition, the fair value of the Company’s loan receivables
and financed service contracts also approximates the carrying amount. The fair value of the Company’s debt is
disclosed in Note 10 and was determined using quoted market prices for those securities.
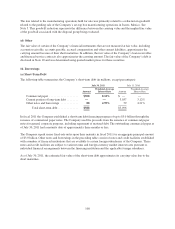
10. Borrowings
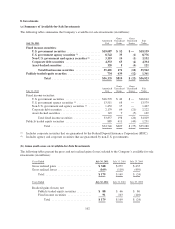
(a) Short-Term Debt
The following table summarizes the Company’s short-term debt (in millions, except percentages):
July 30, 2011 July 31, 2010
Amount
Weighted-Average
Interest Rate Amount
Weighted-Average
Interest Rate
Commercial paper .................... $500 0.14% $— —
Current portion of long-term debt ........ ——3,037 3.12%
Other notes and borrowings ............ 88 4.59% 59 4.21%
Total short-term debt .............. $588 $3,096
In fiscal 2011 the Company established a short-term debt financing program of up to $3.0 billion through the
issuance of commercial paper notes. The Company used the proceeds from the issuance of commercial paper
notes for general corporate purposes, including repayment of matured debt. The outstanding commercial paper as
of July 30, 2011 had a maturity date of approximately three months or less.
The Company repaid senior fixed-rate notes upon their maturity in fiscal 2011 for an aggregate principal amount
of $3.0 billion. Other notes and borrowings in the preceding table consist of notes and credit facilities established
with a number of financial institutions that are available to certain foreign subsidiaries of the Company. These
notes and credit facilities are subject to various terms and foreign currency market interest rates pursuant to
individual financial arrangements between the financing institution and the applicable foreign subsidiary.
As of July 30, 2011, the estimated fair value of the short-term debt approximates its carrying value due to the
short maturities.
108