Cisco 2011 Annual Report Download - page 72
Download and view the complete annual report
Please find page 72 of the 2011 Cisco annual report below. You can navigate through the pages in the report by either clicking on the pages listed below, or by using the keyword search tool below to find specific information within the annual report.-
 1
1 -
2
-
3
-
4
-
5
-
6
-
7
-
8
-
9
-
10
-
11
-
12
-
13
-
14
-
15
-
16
-
17
-
18
-
19
-
20
-
21
-
22
-
23
-
24
-
25
-
26
-
27
-
28
-
29
-
30
-
31
-
32
-
33
-
34
-
35
-
36
-
37
-
38
-
39
-
40
-
41
-
42
-
43
-
44
-
45
-
46
-
47
-
48
-
49
-
50
-
51
-
52
-
53
-
54
-
55
-
56
-
57
-
58
-
59
-
60
-
61
-
 62
62 -
 63
63 -
 64
64 -
 65
65 -
 66
66 -
 67
67 -
 68
68 -
 69
69 -
 70
70 -
 71
71 -
 72
72 -
 73
73 -
 74
74 -
 75
75 -
 76
76 -
 77
77 -
 78
78 -
 79
79 -
 80
80 -
 81
81 -
 82
82 -
83
-
84
-
85
-
86
-
87
-
88
-
89
-
90
-
91
-
92
-
93
-
94
-
95
-
96
-
97
-
98
-
99
-
100
-
101
-
102
-
103
-
104
-
105
-
106
-
107
-
108
-
109
-
110
-
111
-
112
-
113
-
114
-
115
-
116
-
117
-
118
-
119
-
120
-
121
-
122
-
123
-
124
-
125
-
126
-
127
-
128
-
129
-
130
-
131
-
132
-
133
-
134
-
135
-
136
-
137
-
138
-
139
-
140
-
141
-
142
-
143
-
144
-
145
-
146
-
147
-
148
-
149
-
150
-
151
-
152
 |
 |

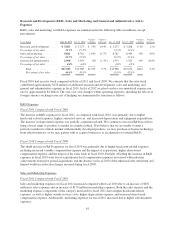
Restructuring and Other Charges
In fiscal 2011, we incurred within operating expenses restructuring charges of $799 million. These charges
included $453 million related to a voluntary early retirement program for eligible employees in the United States
and Canada; $247 million related to employee severance for other employees subject to our reduction of our
work force; and $71 million related to the impairment of goodwill and intangible assets, primarily as a result of
the pending sale of our Juarez, Mexico manufacturing operations. We also recorded charges within operating
expenses of $28 million related to the consolidation of excess facilities and other activities. We announced in
July 2011 that we expected to take up to $1.3 billion in pretax charges as part of our expense reduction actions.
We incurred charges of $728 million in the fourth quarter of fiscal 2011 (included as part of the $799 million
discussed above) related to these announcements. We expect the remaining charges to be incurred during fiscal
2012.
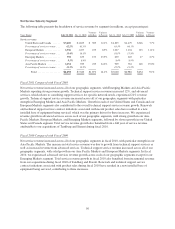
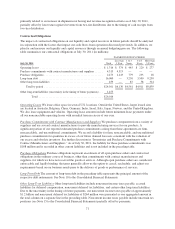
Interest and Other Income, Net
Interest Income (Expense), Net The following table summarizes interest income and interest expense (in
millions):
Years Ended July 30, 2011 July 31, 2010
Variance
in Dollars July 31, 2010 July 25, 2009
Variance
in Dollars
Interest income ................... $ 641 $ 635 $ 6 $ 635 $ 845 $(210)
Interest expense .................. (628) (623) (5) (623) (346) (277)
Interest income (expense), net . . . $13 $ 12 $ 1 $ 12 $ 499 $(487)
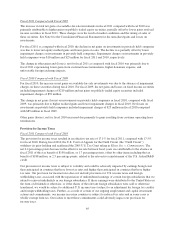
Fiscal 2011 Compared with Fiscal 2010
Interest income increased slightly in fiscal 2011 due to increased income from financing receivables offsetting
the effect of lower average interest rates on our portfolio of cash, cash equivalents, and fixed income
investments. The increase in interest expense in fiscal 2011, as compared with fiscal 2010, was due to higher
average debt balances during fiscal 2011 attributable to our senior debt issuance in March 2011. Partially
offsetting the impact of higher average debt balances during fiscal 2011 is the effect of lower average interest
rates on our debt during fiscal 2011.
Fiscal 2010 Compared with Fiscal 2009
The decrease in interest income in fiscal 2010 compared with fiscal 2009 was due to lower average interest rates,
partially offset by higher average total cash and cash equivalents and fixed income security balances in fiscal
2010. The increase in interest expense in fiscal 2010, compared with fiscal 2009, was primarily due to additional
interest expense related to our senior debt issuances in November 2009 and February 2009.
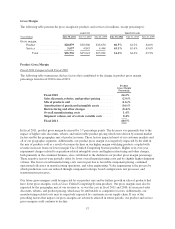
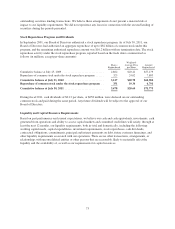
Other Income (Loss), Net The components of other income (loss), net, are summarized as follows (in millions):
Years Ended July 30, 2011 July 31, 2010
Variance
in Dollars July 31, 2010 July 25, 2009
Variance
in Dollars
Gains (losses) on investments, net:
Publicly traded equity securities ....... $88 $ 66 $ 22 $ 66 $ 86 $ (20)
Fixed income securities .............. 91 103 (12) 103 (110) 213
Total available-for-sale investments .... 179 169 10 169 (24) 193
Privately held companies ............. 34 54 (20) 54 (56) 110
Net gains (losses) on investments . . 213 223 (10) 223 (80) 303
Other gains (losses), net .................. (75) 16 (91) 16 (48) 64
Other income (loss), net ...... $138 $239 $(101) $239 $(128) $367
64