Cisco 2011 Annual Report Download - page 106
Download and view the complete annual report
Please find page 106 of the 2011 Cisco annual report below. You can navigate through the pages in the report by either clicking on the pages listed below, or by using the keyword search tool below to find specific information within the annual report.-
 1
1 -
2
-
3
-
4
-
5
-
6
-
7
-
8
-
9
-
10
-
11
-
12
-
13
-
14
-
15
-
16
-
17
-
18
-
19
-
20
-
21
-
22
-
23
-
24
-
25
-
26
-
27
-
28
-
29
-
30
-
31
-
32
-
33
-
34
-
35
-
36
-
37
-
38
-
39
-
40
-
41
-
42
-
43
-
44
-
45
-
46
-
47
-
48
-
49
-
50
-
51
-
52
-
53
-
54
-
55
-
56
-
57
-
58
-
59
-
60
-
61
-
62
-
63
-
64
-
65
-
66
-
67
-
68
-
69
-
70
-
71
-
72
-
73
-
74
-
75
-
76
-
77
-
78
-
79
-
80
-
81
-
82
-
83
-
84
-
85
-
86
-
87
-
88
-
89
-
90
-
91
-
92
-
93
-
94
-
95
-
 96
96 -
 97
97 -
 98
98 -
 99
99 -
 100
100 -
 101
101 -
 102
102 -
 103
103 -
 104
104 -
 105
105 -
 106
106 -
 107
107 -
 108
108 -
 109
109 -
 110
110 -
 111
111 -
 112
112 -
 113
113 -
 114
114 -
 115
115 -
 116
116 -
117
-
118
-
119
-
120
-
121
-
122
-
123
-
124
-
125
-
126
-
127
-
128
-
129
-
130
-
131
-
132
-
133
-
134
-
135
-
136
-
137
-
138
-
139
-
140
-
141
-
142
-
143
-
144
-
145
-
146
-
147
-
148
-
149
-
150
-
151
-
152
 |
 |

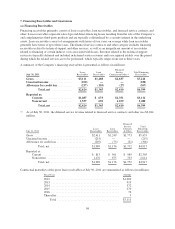
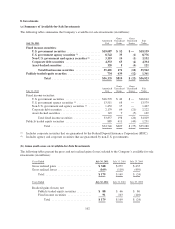
7. Financing Receivables and Guarantees
(a) Financing Receivables
Financing receivables primarily consist of lease receivables, loan receivables, and financed service contracts and
other. Lease receivables represent sales-type and direct-financing leases resulting from the sale of the Company’s
and complementary third-party products and are typically collateralized by a security interest in the underlying
assets. Lease receivables consist of arrangements with terms of four years on average while loan receivables
generally have terms of up to three years. The financed service contracts and other category includes financing
receivables related to technical support and other services, as well as an insignificant amount of receivables
related to financing of certain indirect costs associated with leases. Revenue related to the technical support
services is typically deferred and included in deferred service revenue and is recognized ratably over the period
during which the related services are to be performed, which typically ranges from one to three years.
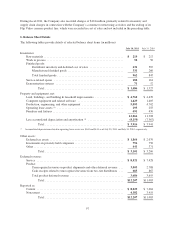
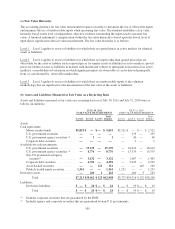
A summary of the Company’s financing receivables is presented as follows (in millions):
July 30, 2011
Lease
Receivables
Loan
Receivables
Financed
Service
Contracts & Other (1)
Total Financing
Receivables
Gross .......................... $3,111 $1,468 $2,637 $7,216
Unearned income ................ (250) — — (250)
Allowance for credit loss .......... (237) (103) (27) (367)
Total, net .............. $2,624 $1,365 $2,610 $6,599
Reported as:
Current .................... $1,087 $ 673 $1,351 $3,111
Noncurrent ................. 1,537 692 1,259 3,488
Total, net .............. $2,624 $1,365 $2,610 $6,599
(1) As of July 30, 2011, the deferred service revenue related to financed service contracts and other was $2,044
million.
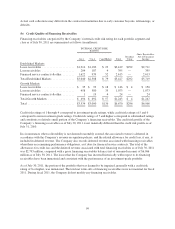
July 31, 2010
Lease
Receivables
Loan
Receivables
Financed
Service
Contracts
& Other
Total
Financing
Receivables
Gross ................................... $2,411 $1,249 $1,773 $5,433
Unearned income .......................... (215) — — (215)
Allowance for credit loss .................... (207) (73) (21) (301)
Total, net ........................ $1,989 $1,176 $1,752 $4,917
Reported as:
Current .............................. $ 813 $ 501 $ 989 $2,303
Noncurrent ........................... 1,176 675 763 2,614
Total, net ........................ $1,989 $1,176 $1,752 $4,917
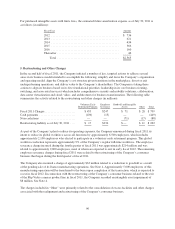
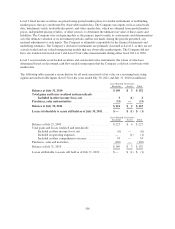
Contractual maturities of the gross lease receivables at July 30, 2011 are summarized as follows (in millions):
Fiscal Year Amount
2012 .............................................. $1,269
2013 .............................................. 919
2014 .............................................. 572
2015 .............................................. 270
2016 .............................................. 76
Thereafter .......................................... 5
Total .......................................... $3,111
98