Cisco 2011 Annual Report Download - page 76
Download and view the complete annual report
Please find page 76 of the 2011 Cisco annual report below. You can navigate through the pages in the report by either clicking on the pages listed below, or by using the keyword search tool below to find specific information within the annual report.-
 1
1 -
2
-
3
-
4
-
5
-
6
-
7
-
8
-
9
-
10
-
11
-
12
-
13
-
14
-
15
-
16
-
17
-
18
-
19
-
20
-
21
-
22
-
23
-
24
-
25
-
26
-
27
-
28
-
29
-
30
-
31
-
32
-
33
-
34
-
35
-
36
-
37
-
38
-
39
-
40
-
41
-
42
-
43
-
44
-
45
-
46
-
47
-
48
-
49
-
50
-
51
-
52
-
53
-
54
-
55
-
56
-
57
-
58
-
59
-
60
-
61
-
62
-
63
-
64
-
65
-
 66
66 -
 67
67 -
 68
68 -
 69
69 -
 70
70 -
 71
71 -
 72
72 -
 73
73 -
 74
74 -
 75
75 -
 76
76 -
 77
77 -
 78
78 -
 79
79 -
 80
80 -
 81
81 -
 82
82 -
 83
83 -
 84
84 -
 85
85 -
 86
86 -
87
-
88
-
89
-
90
-
91
-
92
-
93
-
94
-
95
-
96
-
97
-
98
-
99
-
100
-
101
-
102
-
103
-
104
-
105
-
106
-
107
-
108
-
109
-
110
-
111
-
112
-
113
-
114
-
115
-
116
-
117
-
118
-
119
-
120
-
121
-
122
-
123
-
124
-
125
-
126
-
127
-
128
-
129
-
130
-
131
-
132
-
133
-
134
-
135
-
136
-
137
-
138
-
139
-
140
-
141
-
142
-
143
-
144
-
145
-
146
-
147
-
148
-
149
-
150
-
151
-
152
 |
 |

build-to-stock products. All inventories are accounted for at the lower of cost or market. Inventory is written down
based on excess and obsolete inventories determined primarily by future demand forecasts. Inventory write-downs
are measured as the difference between the cost of the inventory and market, based upon assumptions about future
demand, and are charged to the provision for inventory, which is a component of our cost of sales.
Our ending balance for purchase commitments with contract manufacturers and suppliers reflects improvement
and stabilization in lead times and the mitigation of many of the constraints at our component suppliers that we
experienced in fiscal 2010. Due to the earthquake in Japan and resulting industry-wide component supply
constraints, we made increased commitments to secure our near-term supply needs. Offsetting these increases in
purchase commitments were actions we have taken related to the restructuring of our consumer business. While
we may experience longer than normal lead times in the future, our lead times to customers improved on nearly
all of our products during fiscal 2011 and as of the end of fiscal 2011 were within a normal range for nearly all of
our products.
We purchase components from a variety of suppliers and use several contract manufacturers to provide
manufacturing services for our products. During the normal course of business, in order to manage
manufacturing lead times and help ensure adequate component supply, we enter into agreements with contract
manufacturers and suppliers that allow them to procure inventory based upon criteria as defined by us or that
establish the parameters defining our requirements and our commitment to securing manufacturing capacity. A
significant portion of our reported purchase commitments arising from these agreements are firm, noncancelable,
and unconditional commitments. In certain instances, these agreements allow us the option to cancel, reschedule,
and adjust our requirements based on our business needs prior to firm orders being placed. Our purchase
commitments are for short-term product manufacturing requirements as well as for commitments to suppliers to
secure manufacturing capacity.
We record a liability, included in other current liabilities, for firm, noncancelable, and unconditional purchase
commitments for quantities in excess of our future demand forecasts consistent with the valuation of our excess
and obsolete inventory. The purchase commitments for inventory are expected to be primarily fulfilled within
one year.
Inventory and supply chain management remain areas of focus as we balance the need to maintain supply chain
flexibility to help ensure competitive lead times with the risk of inventory obsolescence because of rapidly
changing technology and customer requirements. We believe the amount of our inventory and purchase
commitments is appropriate for our revenue levels.
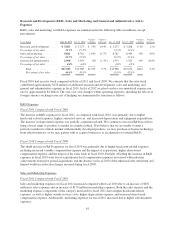
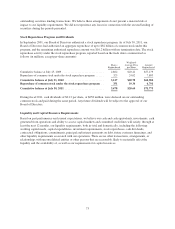
Financing Receivables and Guarantees We measure our net balance sheet exposure position related to our
financing receivables and financing guarantees by reducing the total of gross financing receivables and financing
guarantees by the associated allowances for credit loss and deferred revenue. As of July 30, 2011, our net balance
sheet exposure position related to financing receivables and financing guarantees was as follows (in millions):
FINANCING RECEIVABLES
FINANCING
GUARANTEES TOTAL
July 30, 2011
Lease
Receivables
Loan
Receivables
Financed
Service
Contracts
and Other Total
Channel
Partner
End-User
Customers Total
Gross amount less unearned income . . $2,861 $1,468 $ 2,637 $ 6,966 $ 336 $ 277 $ 613 $ 7,579
Allowance for credit loss .......... (237) (103) (27) (367) — — — (367)
Deferred revenue ................ (120) (262) (2,044) (2,426) (248) (248) (496) (2,922)
Net balance sheet exposure .... $2,504 $1,103 $ 566 $ 4,173 $ 88 $ 29 $ 117 $ 4,290
Financing Receivables Gross financing receivables less unearned income have increased by 33% compared with
the end of fiscal 2010, driven by a 49% increase in gross financed service contracts, a 30% increase in gross lease
receivables, and an 18% increase in gross loan receivables. We provide financing to certain end-user customers
68