Blackberry 2016 Annual Report Download - page 94
Download and view the complete annual report
Please find page 94 of the 2016 Blackberry annual report below. You can navigate through the pages in the report by either clicking on the pages listed below, or by using the keyword search tool below to find specific information within the annual report.-
 1
1 -
2
-
3
-
4
-
5
-
6
-
7
-
8
-
9
-
10
-
11
-
12
-
13
-
14
-
15
-
16
-
17
-
18
-
19
-
20
-
21
-
22
-
23
-
24
-
25
-
26
-
27
-
28
-
29
-
30
-
31
-
32
-
33
-
34
-
35
-
36
-
37
-
38
-
39
-
40
-
41
-
42
-
43
-
44
-
45
-
46
-
47
-
48
-
49
-
50
-
51
-
52
-
53
-
54
-
55
-
56
-
57
-
58
-
59
-
60
-
61
-
62
-
63
-
64
-
65
-
66
-
67
-
68
-
69
-
70
-
71
-
72
-
73
-
74
-
75
-
76
-
77
-
78
-
79
-
80
-
81
-
82
-
83
-
 84
84 -
 85
85 -
 86
86 -
 87
87 -
 88
88 -
 89
89 -
 90
90 -
 91
91 -
 92
92 -
 93
93 -
 94
94 -
 95
95 -
 96
96 -
 97
97 -
 98
98 -
 99
99 -
 100
100 -
 101
101 -
 102
102 -
 103
103 -
 104
104 -
105
-
106
-
107
-
108
-
109
-
110
-
111
-
112
-
113
-
114
-
115
-
116
-
117
-
118
-
119
-
120
-
121
-
122
-
123
-
124
-
125
-
126
-
127
-
128
-
129
-
130
-
131
-
132
-
133
-
134
-
135
-
136
-
137
-
138
 |
 |

BlackBerry Limited
Notes to the Consolidated Financial Statements
In millions of United States dollars, except share and per share data, and except as otherwise indicated
26
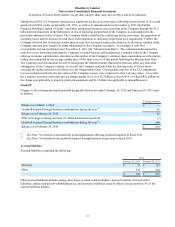
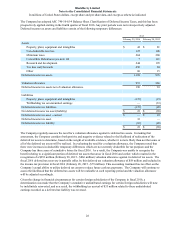
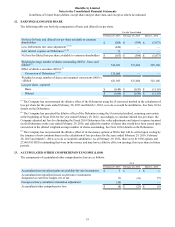
The following table sets forth the activity in the Company’s RAP liability for fiscal 2016:
Employee
Termination
Benefits Facilities
Costs Manufacturing
Costs Other Charges(1) Total
Charges incurred $ 73 $ 41 $ 16 $ 6 $ 136
Cash payments made (61) (15)(16)(6)(98)
Balance as at February 29, 2016 $ 12 $ 26 $ — $ — $ 38
(1) Other charges consist of costs associated with duplicate redundant systems from acquisitions which are being integrated
into a single solution, and the effect of foreign exchange.
The RAP charges, including non-cash charges incurred in fiscal 2016 were as follows:
Cost of sales $ 44
Research and development 47
Selling, marketing and administration 253
Total RAP charges $ 344
As discussed in Note 6, during fiscal 2016 the Company completed a targeted review of the individual patents comprising
its patent portfolio. As a result of this review, the Company ceased enforcement and abandoned legal right and title to a
number of patents, incurring a charge of approximately $136 million relating to the abandonment.
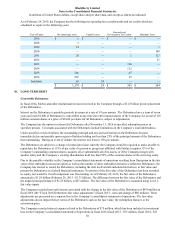
Cost Optimization and Resource Efficiency (“CORE”) Program
In fiscal 2013, the Company commenced the CORE program with the objective of improving the Company’s operations
and increasing efficiency. During fiscal 2016, the Company incurred approximately $11 million in total pre-tax charges
related to the CORE program, related to employee termination benefits, facilities and manufacturing network
simplification costs. During fiscal 2016, the Company made cash payments of $29 million related to the CORE program,
as shown in the table below.
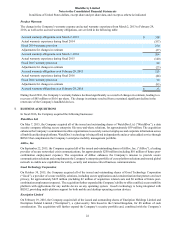
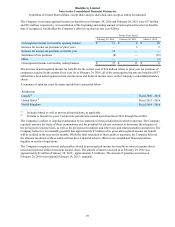
The following table sets forth the activity in the Company’s CORE program liability for fiscal 2016 and fiscal 2015:
Employee
Termination
Benefits
Facilities Costs
and Foreign
Exchange
Manufacturing
Costs and Foreign
Exchange Total
Balance as at March 1, 2014 $ 13 $ 53 $ 26 $ 92
Charges incurred 96 48 55 199
Cash payments made (106)(71)(79)(256)
Balance as at February 28, 2015 3 30 2 35
Charges incurred — 12 (2) 10
Cash payments made (3)(26) — (29)
Balance as at February 29, 2016 $ — $ 16 $ — $ 16
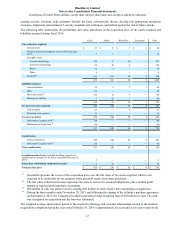
The CORE program charges, including non-cash charges incurred in fiscal 2016, fiscal 2015 and fiscal 2014, were as
follows:
For the Years Ended
February 29, 2016 February 28, 2015 March 1, 2014
Cost of sales $ — $ 23 $ 103
Research and development 2 70 76
Selling, marketing and administration 9 229 333
Total CORE program charges $ 11 $ 322 $ 512
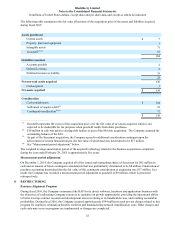
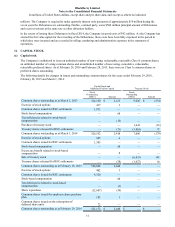
As part of the CORE program, the Company decided to sell certain redundant assets and discontinue certain operations to
drive cost savings and efficiencies in the Company, which included divesting the majority of its Canadian commercial real
estate portfolio (the “Real Estate Sale”) in fiscal 2015. The Company recorded no losses in fiscal 2016 ($12 million in