Blackberry 2016 Annual Report Download - page 133
Download and view the complete annual report
Please find page 133 of the 2016 Blackberry annual report below. You can navigate through the pages in the report by either clicking on the pages listed below, or by using the keyword search tool below to find specific information within the annual report.-
 1
1 -
2
-
3
-
4
-
5
-
6
-
7
-
8
-
9
-
10
-
11
-
12
-
13
-
14
-
15
-
16
-
17
-
18
-
19
-
20
-
21
-
22
-
23
-
24
-
25
-
26
-
27
-
28
-
29
-
30
-
31
-
32
-
33
-
34
-
35
-
36
-
37
-
38
-
39
-
40
-
41
-
42
-
43
-
44
-
45
-
46
-
47
-
48
-
49
-
50
-
51
-
52
-
53
-
54
-
55
-
56
-
57
-
58
-
59
-
60
-
61
-
62
-
63
-
64
-
65
-
66
-
67
-
68
-
69
-
70
-
71
-
72
-
73
-
74
-
75
-
76
-
77
-
78
-
79
-
80
-
81
-
82
-
83
-
84
-
85
-
86
-
87
-
88
-
89
-
90
-
91
-
92
-
93
-
94
-
95
-
96
-
97
-
98
-
99
-
100
-
101
-
102
-
103
-
104
-
105
-
106
-
107
-
108
-
109
-
110
-
111
-
112
-
113
-
114
-
115
-
116
-
117
-
118
-
119
-
120
-
121
-
122
-
 123
123 -
 124
124 -
 125
125 -
 126
126 -
 127
127 -
 128
128 -
 129
129 -
 130
130 -
 131
131 -
 132
132 -
 133
133 -
 134
134 -
 135
135 -
 136
136 -
 137
137 -
 138
138
 |
 |
BlackBerry Limited
Management’s Discussion and Analysis of Financial Condition and Results of Operations
25
The weighted average number of shares outstanding was 525 million common shares for basic and diluted loss per share for the
fourth quarter of fiscal 2016. The weighted average number of shares outstanding was 529 million common shares for basic
and diluted earnings per share for the fourth quarter of fiscal 2015.
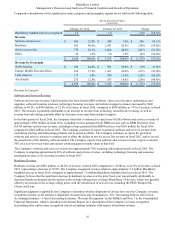
Selected Quarterly Financial Data
The following table sets forth the Company’s unaudited quarterly consolidated results of operations data for each of the eight
most recent quarters, including the quarter ended February 29, 2016. The information in the table below has been derived from
the Company’s unaudited interim consolidated financial statements that, in management’s opinion, have been prepared on a
basis consistent with the audited consolidated financial statements of the Company and include all adjustments necessary for a
fair presentation of information when read in conjunction with the audited consolidated financial statements of the Company.
The Company’s quarterly operating results have varied substantially in the past and may vary substantially in the future.
Accordingly, the information below is not necessarily indicative of results for any future quarter.
(in millions, except per share data)
Fiscal Year 2016 Fiscal Year 2015
Fourth
Quarter Third
Quarter Second
Quarter First
Quarter Fourth
Quarter Third
Quarter Second
Quarter First
Quarter
Revenue $ 464 $ 548 $ 490 $ 658 $ 660 $ 793 $ 916 $ 966
Gross margin 210 236 185 310 318 410 425 451
Operating expenses 451 340 152 221 424 549 623 431
Income (loss) before income
taxes (256) (120) 21 73 (1)(160)(218)(6)
Provision for (recovery of)
income taxes (18) (31) (30) 5 (29)(12)(11)(29)
Net income (loss) $ (238) $ (89) $ 51 $ 68 $ 28 $ (148) $ (207) $ 23
Earnings (loss) per share
Basic earnings (loss) per
share $ (0.45) $ (0.17) $ 0.10 $ 0.13 $ 0.05 $ (0.28) $ (0.39) $ 0.04
Diluted earnings (loss) per
share $ (0.45) $ (0.17) $ (0.24) $ (0.10) $ 0.05 $ (0.28) $ (0.39) $ (0.37)
Research and development $ 108 $ 100 $ 122 $ 139 $ 134 $ 154 $ 186 $ 237
Selling, marketing and
administration 179 175 186 173 138 171 195 400
Amortization 77 68 67 65 68 74 75 81
Abandonment/impairment of
long-lived assets 127 2 5 1 34 — — —
Debentures fair value
adjustment (40) (5) (228)(157) 50 150 167 (287)
Operating expenses $ 451 $ 340 $ 152 $ 221 $ 424 $ 549 $ 623 $ 431
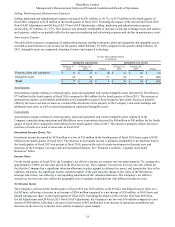
Financial Condition
Liquidity and Capital Resources
Cash, cash equivalents, and investments decreased by $642 million to $2.6 billion as at February 29, 2016 from $3.3 billion as
at February 28, 2015, primarily as a result of the Good, AtHoc, WatchDox and Encription acquisitions and cash used in the
Repurchase Program, partially offset by receipt of the Company’s fiscal 2015 Canadian income tax refund. The majority of the
Company’s cash, cash equivalents, and investments are denominated in U.S. dollars as at February 29, 2016.