Blackberry 2016 Annual Report Download - page 126
Download and view the complete annual report
Please find page 126 of the 2016 Blackberry annual report below. You can navigate through the pages in the report by either clicking on the pages listed below, or by using the keyword search tool below to find specific information within the annual report.-
 1
1 -
2
-
3
-
4
-
5
-
6
-
7
-
8
-
9
-
10
-
11
-
12
-
13
-
14
-
15
-
16
-
17
-
18
-
19
-
20
-
21
-
22
-
23
-
24
-
25
-
26
-
27
-
28
-
29
-
30
-
31
-
32
-
33
-
34
-
35
-
36
-
37
-
38
-
39
-
40
-
41
-
42
-
43
-
44
-
45
-
46
-
47
-
48
-
49
-
50
-
51
-
52
-
53
-
54
-
55
-
56
-
57
-
58
-
59
-
60
-
61
-
62
-
63
-
64
-
65
-
66
-
67
-
68
-
69
-
70
-
71
-
72
-
73
-
74
-
75
-
76
-
77
-
78
-
79
-
80
-
81
-
82
-
83
-
84
-
85
-
86
-
87
-
88
-
89
-
90
-
91
-
92
-
93
-
94
-
95
-
96
-
97
-
98
-
99
-
100
-
101
-
102
-
103
-
104
-
105
-
106
-
107
-
108
-
109
-
110
-
111
-
112
-
113
-
114
-
115
-
 116
116 -
 117
117 -
 118
118 -
 119
119 -
 120
120 -
 121
121 -
 122
122 -
 123
123 -
 124
124 -
 125
125 -
 126
126 -
 127
127 -
 128
128 -
 129
129 -
 130
130 -
 131
131 -
 132
132 -
 133
133 -
 134
134 -
 135
135 -
 136
136 -
137
-
138
 |
 |

BlackBerry Limited
Management’s Discussion and Analysis of Financial Condition and Results of Operations
18
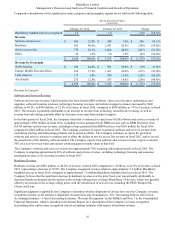
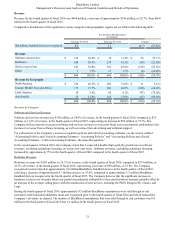
Latin America Revenues
Revenues in Latin America were $117 million, or 5.4% of revenue, in fiscal 2016, reflecting a decrease of $263 million
compared to $380 million, or 11.4% of revenue, in fiscal 2015. The decrease in revenues is due to decreased hardware demand
and the continued erosion of revenues from service access fees.
Some of the larger markets comprising this region include Argentina, Mexico and Brazil.
Asia Pacific Revenues
Revenues in Asia Pacific were $275 million, or 12.8% of revenue, in fiscal 2016, reflecting a decrease of $258 million
compared to $533 million, or 16.0% of revenue, in fiscal 2015. The decrease in revenues is due to decreased hardware demand
and the continued erosion of revenues from service access fees, partially offset by Classic and PRIV device sales and revenue
associated with Good.
Some of the larger markets comprising this region include Indonesia, Hong Kong and India.
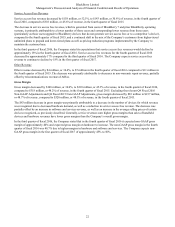
Gross Margin
Gross margin decreased by $663 million or 41.3%, to $941 million, or 43.6% of revenue, in fiscal 2016, compared to $1.6
billion, or 48.1% of revenue, in fiscal 2015. Excluding the relevant Fiscal 2016 Non-GAAP Adjustments and Fiscal 2015 Non-
GAAP Adjustments explained in “Non-GAAP Financial Measures” above, gross margin decreased by $610 million to $1.0
billion, or 46.5% of revenue, compared to 1.6 billion, or 48.8% of revenue, in fiscal 2015.
The $610 million decrease in gross margin was primarily attributable to a decrease in the number of devices for which revenue
was recognized due to decreased hardware demand, as well as a reduction in service access fees revenue, partially offset by the
increase in software and services revenue, as well as an increase in the average selling prices of certain devices recognized, as
previously described compared to fiscal 2015. Generally, service revenues earn higher gross margins than sales of handheld
devices and hardware revenues have lower gross margins than the Company’s overall gross margin.
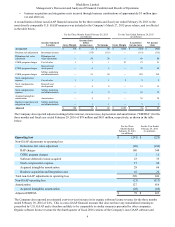
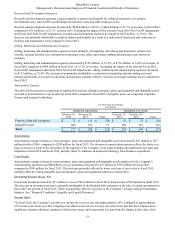
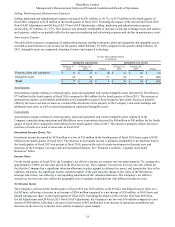
Operating Expenses
The table below presents a comparison of research and development, selling, marketing and administration, and amortization
expense for fiscal 2016 compared to fiscal 2015.
For the Fiscal Years Ended
(in millions)
February 29, 2016 February 28, 2015 Change
% of
Revenue % of
Revenue % of
Change
Revenue(1) $ 2,160 $ 3,335 $ (1,175) (35.2)%
Operating expenses
Research and development(1)(2) 469 21.7 % 711 21.3% $ (242) (34.0)%
Selling, marketing and administration(1)(2) 712 33.0 % 904 27.1% (192) (21.2)%
Amortization(1)(2) 277 12.8 % 298 8.9% (21) (7.0)%
Abandonment/impairment of long-lived
assets 136 6.3 % 34 1.0% 102 300.0 %
Debentures fair value adjustment(1)(2) (430) (19.9)% 80 2.4% (510) (637.5)%
Total $ 1,164 53.9 % $ 2,027 60.7% $ (863) (42.6)%
(1) See “Non-GAAP Financial Measures” for the impact of the Fiscal 2016 Non-GAAP Adjustments on revenue and
operating expenses in fiscal 2016.
(2) See “Non-GAAP Financial Measures” for the impact of the Fiscal 2015 Non-GAAP Adjustments on operating
expenses in fiscal 2015.
Operating expenses decreased by $863 million, or 42.6%, to $1.2 billion, or 53.9% of revenue in fiscal 2016, compared to $2
billion, or 60.7% of revenue, in fiscal 2015. Excluding the impact of the relevant Fiscal 2016 Non-GAAP Adjustments and
Fiscal 2015 Non-GAAP Adjustments, operating expenses decreased by $424 million, or 27.2%. This decrease was primarily
attributable to a decrease in salaries and benefits costs due to a reduction in headcount and decline in marketing and advertising
expenses, partially offset by increases in foreign exchange losses.