Blackberry 2016 Annual Report Download - page 124
Download and view the complete annual report
Please find page 124 of the 2016 Blackberry annual report below. You can navigate through the pages in the report by either clicking on the pages listed below, or by using the keyword search tool below to find specific information within the annual report.-
 1
1 -
2
-
3
-
4
-
5
-
6
-
7
-
8
-
9
-
10
-
11
-
12
-
13
-
14
-
15
-
16
-
17
-
18
-
19
-
20
-
21
-
22
-
23
-
24
-
25
-
26
-
27
-
28
-
29
-
30
-
31
-
32
-
33
-
34
-
35
-
36
-
37
-
38
-
39
-
40
-
41
-
42
-
43
-
44
-
45
-
46
-
47
-
48
-
49
-
50
-
51
-
52
-
53
-
54
-
55
-
56
-
57
-
58
-
59
-
60
-
61
-
62
-
63
-
64
-
65
-
66
-
67
-
68
-
69
-
70
-
71
-
72
-
73
-
74
-
75
-
76
-
77
-
78
-
79
-
80
-
81
-
82
-
83
-
84
-
85
-
86
-
87
-
88
-
89
-
90
-
91
-
92
-
93
-
94
-
95
-
96
-
97
-
98
-
99
-
100
-
101
-
102
-
103
-
104
-
105
-
106
-
107
-
108
-
109
-
110
-
111
-
112
-
113
-
 114
114 -
 115
115 -
 116
116 -
 117
117 -
 118
118 -
 119
119 -
 120
120 -
 121
121 -
 122
122 -
 123
123 -
 124
124 -
 125
125 -
 126
126 -
 127
127 -
 128
128 -
 129
129 -
 130
130 -
 131
131 -
 132
132 -
 133
133 -
 134
134 -
135
-
136
-
137
-
138
 |
 |
BlackBerry Limited
Management’s Discussion and Analysis of Financial Condition and Results of Operations
16
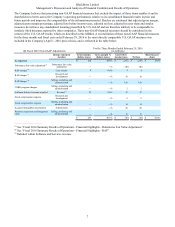
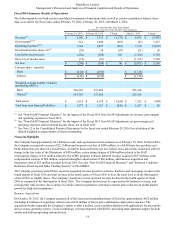
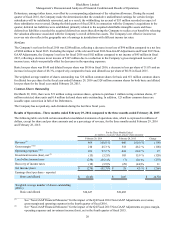
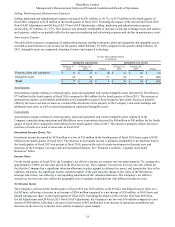
Comparative breakdowns of the significant revenue categories and geographic regions are set forth in the following table:
For the Fiscal Years Ended
(in millions)
February 29, 2016 February 28, 2015 Change
BlackBerry handheld devices recognized 3.2 7.0 (3.8) (54.3)%
Revenue
Software and services $ 494 22.8% $ 248 7.4% $ 246 99.2 %
Hardware 862 40.0% 1,431 42.9% (569) (39.8)%
Service access fees 779 36.1% 1,606 48.2% (827) (51.5)%
Other 25 1.2% 50 1.5% (25) (50.0)%
$ 2,160 100.0% $ 3,335 100.0% $ (1,175) (35.2)%
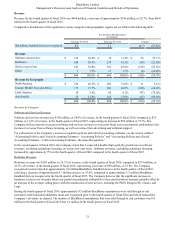
Revenue by Geography
North America $ 952 44.0% $ 991 29.6% $ (39) (3.9)%
Europe, Middle East and Africa 816 37.8% 1,431 43.0% (615) (43.0)%
Latin America 117 5.4% 380 11.4% (263) (69.2)%
Asia Pacific 275 12.8% 533 16.0% (258) (48.4)%
$ 2,160 100.0% $ 3,335 100.0% $ (1,175) (35.2)%
Revenue by Category
Software and Services Revenue
Software and services revenue, which includes fees from licensed BES software, client access licenses, maintenance and
upgrades, software licensing revenues, technology licensing revenues, and technical support revenues, increased by $246
million, or 99.2%, to $494 million, or 22.8% of revenue, in fiscal 2016, compared to $248 million, or 7.4% of revenue, in fiscal
2015. The increase is primarily attributable to an increase in revenue from technology and software licensing, as well as
revenue from advertising, partially offset by decreases in revenue from technical support.
In the third quarter of fiscal 2016, the Company stated that it continued to expect non-GAAP software and services revenue of
approximately $500 million in fiscal 2016, excluding revenue generated from BBM services such as BBM Protected. Non-
GAAP software and services revenue, excluding revenue generated from BBM services, was $501 million for fiscal 2016
compared to $244 million in fiscal 2015. The Company continues to expect to generate software and services revenue from
monetizing existing and forthcoming products and its patent portfolio. The Company continues to expect the growth of
software and services revenue to continue and to offset the decline in service access fees revenue in fiscal 2017, and to exceed
the growth rate of the mobility software market. The Company expects total software and services revenue to grow at around
30% on a year-over-year basis and expects continued gains in market share at that level.
The Company’s software and services revenue was approximately 70% recurring (subscription based) in fiscal 2016. The
Company is targeting approximately 80% of software and services revenue, excluding technology licensing and consumer
messaging revenue, to be recurring in nature in fiscal 2017.
Hardware Revenue
Hardware revenue was $862 million, or 40.0% of revenue, in fiscal 2016 compared to 1.4 billion, or 42.9% of revenue, in fiscal
2015, representing a decrease of 39.8%. The Company recognized revenue related to approximately 3.2 million BlackBerry
handheld devices in fiscal 2016, compared to approximately 7.0 million BlackBerry handheld devices in fiscal 2015. The
Company believes that the significant decrease in hardware revenue over the prior fiscal year was primarily attributable to
decreased hardware demand and the decline in the average selling prices of legacy BlackBerry 10 devices, which was partially
offset by an increase in the average selling prices with the introduction of new devices, including the PRIV, Passport SE,
Classic and Leap.
Significant judgment is applied by the Company to determine whether shipments of devices have met the Company’s revenue
recognition criteria, as the analysis is dependent on many facts and circumstances. See “Accounting Policies and Critical
Accounting Estimates - Critical Accounting Estimates - Revenue Recognition” in this MD&A and Note 1 to the Consolidated
Financial Statements, which is included in the Annual Report, for a description of the Company’s revenue recognition
accounting policy and revenue recognition critical accounting estimates with respect to hardware revenue.