Blackberry 2016 Annual Report Download - page 115
Download and view the complete annual report
Please find page 115 of the 2016 Blackberry annual report below. You can navigate through the pages in the report by either clicking on the pages listed below, or by using the keyword search tool below to find specific information within the annual report.
BlackBerry Limited
Management’s Discussion and Analysis of Financial Condition and Results of Operations
7
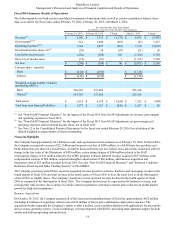
The Company believes that presenting non-GAAP financial measures that exclude the impact of those items enables it and its
shareholders to better assess the Company’s operating performance relative to its consolidated financial results in prior and
future periods and improves the comparability of the information presented. Readers are cautioned that adjusted gross margin,
adjusted gross margin percentage, adjusted loss before income taxes, adjusted net loss, adjusted loss per share and similar
measures do not have any standardized meaning prescribed by U.S. GAAP and are therefore unlikely to be comparable to
similarly titled measures reported by other companies. These non-GAAP financial measures should be considered in the
context of the U.S. GAAP results, which are described in this MD&A. A reconciliation of these non-GAAP financial measures
for the three months and fiscal year ended February 29, 2016 to the most directly comparable U.S. GAAP measures was
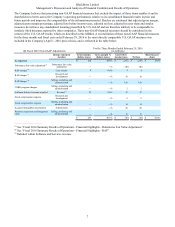
included in the Company’s April 1, 2016 press release, and is reflected in the table below:
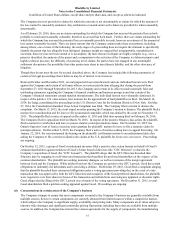
Q4 Fiscal 2016 Non-GAAP Adjustments For the Three Months Ended February 29, 2016
(in millions)
Income statement
location Gross margin
(before taxes) Gross margin %
(before taxes) Loss before
income taxes Net loss Basic loss per
share
As reported $ 210 45.3% $ (256) $ (238) $ (0.45)
Debentures fair value adjustment(1) Debentures fair value
adjustment — —% (40) (40)
RAP charges (2) Cost of sales 4 0.8% 4 4
RAP charges (2) Research and
development — —% 18 18
RAP charges (2) Selling, marketing and
administration — —% 158 158
CORE program charges Selling, marketing and
administration — —% 2 2
Software deferred revenue acquired Revenue(3) 23 2.6% 23 23
Stock compensation expense Research and
development — —% 5 5
Stock compensation expense Selling, marketing and
administration — —% 12 12
Acquired intangibles amortization Amortization — —% 28 28
Business acquisition and integration
costs Selling, marketing and
administration — —% 10 10
$ 237 48.7% $ (36) $ (18) $ (0.03)
______________________________
(1) See “Fiscal 2016 Summary Results of Operations - Financial Highlights - Debentures Fair Value Adjustment”.
(2) See “Fiscal 2016 Summary Results of Operations - Financial Highlights - RAP”.
(3) Included within Software and Services revenue.


