Blackberry 2016 Annual Report Download - page 66
Download and view the complete annual report
Please find page 66 of the 2016 Blackberry annual report below. You can navigate through the pages in the report by either clicking on the pages listed below, or by using the keyword search tool below to find specific information within the annual report.-
 1
1 -
2
-
3
-
4
-
5
-
6
-
7
-
8
-
9
-
10
-
11
-
12
-
13
-
14
-
15
-
16
-
17
-
18
-
19
-
20
-
21
-
22
-
23
-
24
-
25
-
26
-
27
-
28
-
29
-
30
-
31
-
32
-
33
-
34
-
35
-
36
-
37
-
38
-
39
-
40
-
41
-
42
-
43
-
44
-
45
-
46
-
47
-
48
-
49
-
50
-
51
-
52
-
53
-
54
-
55
-
 56
56 -
 57
57 -
 58
58 -
 59
59 -
 60
60 -
 61
61 -
 62
62 -
 63
63 -
 64
64 -
 65
65 -
 66
66 -
 67
67 -
 68
68 -
 69
69 -
 70
70 -
 71
71 -
 72
72 -
 73
73 -
 74
74 -
 75
75 -
 76
76 -
77
-
78
-
79
-
80
-
81
-
82
-
83
-
84
-
85
-
86
-
87
-
88
-
89
-
90
-
91
-
92
-
93
-
94
-
95
-
96
-
97
-
98
-
99
-
100
-
101
-
102
-
103
-
104
-
105
-
106
-
107
-
108
-
109
-
110
-
111
-
112
-
113
-
114
-
115
-
116
-
117
-
118
-
119
-
120
-
121
-
122
-
123
-
124
-
125
-
126
-
127
-
128
-
129
-
130
-
131
-
132
-
133
-
134
-
135
-
136
-
137
-
138
 |
 |
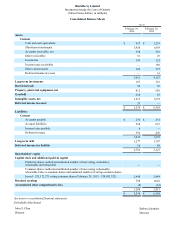
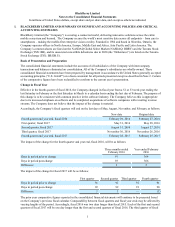
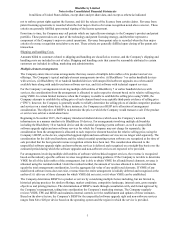
6
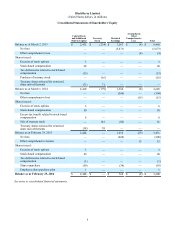
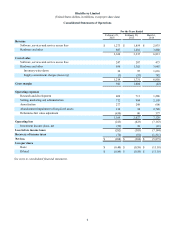
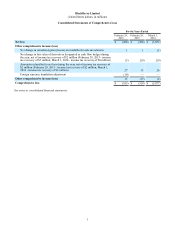
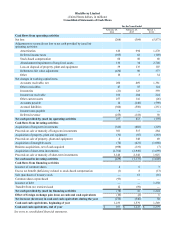
BlackBerry Limited
(United States dollars, in millions, except per share data)
Consolidated Statements of Operations
For the Years Ended
February 29,
2016 February 28,
2015 March 1,
2014
Revenue
Software, services and service access fees $ 1,273 $ 1,854 $ 2,933
Hardware and other 887 1,481 3,880
2,160 3,335 6,813
Cost of sales
Software, services and service access fees 247 287 473
Hardware and other 939 1,382 3,985
Inventory write-down 36 95 1,616
Supply commitment charges (recovery) (3)(33) 782
1,219 1,731 6,856
Gross margin 941 1,604 (43)
Operating expenses
Research and development 469 711 1,286
Selling, marketing and administration 712 904 2,103
Amortization 277 298 606
Abandonment/impairment of long-lived assets 136 34 2,748
Debentures fair value adjustment (430) 80 377
1,164 2,027 7,120
Operating loss (223)(423)(7,163)
Investment income (loss), net (59) 38 (21)
Loss before income taxes (282)(385)(7,184)
Recovery of income taxes (74)(81)(1,311)
Net loss $(208) $ (304) $ (5,873)
Loss per share
Basic $(0.40) $ (0.58) $ (11.18)
Diluted $(0.86) $ (0.58) $ (11.18)
See notes to consolidated financial statements.