Blackberry 2016 Annual Report Download - page 125
Download and view the complete annual report
Please find page 125 of the 2016 Blackberry annual report below. You can navigate through the pages in the report by either clicking on the pages listed below, or by using the keyword search tool below to find specific information within the annual report.-
 1
1 -
2
-
3
-
4
-
5
-
6
-
7
-
8
-
9
-
10
-
11
-
12
-
13
-
14
-
15
-
16
-
17
-
18
-
19
-
20
-
21
-
22
-
23
-
24
-
25
-
26
-
27
-
28
-
29
-
30
-
31
-
32
-
33
-
34
-
35
-
36
-
37
-
38
-
39
-
40
-
41
-
42
-
43
-
44
-
45
-
46
-
47
-
48
-
49
-
50
-
51
-
52
-
53
-
54
-
55
-
56
-
57
-
58
-
59
-
60
-
61
-
62
-
63
-
64
-
65
-
66
-
67
-
68
-
69
-
70
-
71
-
72
-
73
-
74
-
75
-
76
-
77
-
78
-
79
-
80
-
81
-
82
-
83
-
84
-
85
-
86
-
87
-
88
-
89
-
90
-
91
-
92
-
93
-
94
-
95
-
96
-
97
-
98
-
99
-
100
-
101
-
102
-
103
-
104
-
105
-
106
-
107
-
108
-
109
-
110
-
111
-
112
-
113
-
114
-
 115
115 -
 116
116 -
 117
117 -
 118
118 -
 119
119 -
 120
120 -
 121
121 -
 122
122 -
 123
123 -
 124
124 -
 125
125 -
 126
126 -
 127
127 -
 128
128 -
 129
129 -
 130
130 -
 131
131 -
 132
132 -
 133
133 -
 134
134 -
 135
135 -
136
-
137
-
138
 |
 |

BlackBerry Limited
Management’s Discussion and Analysis of Financial Condition and Results of Operations
17
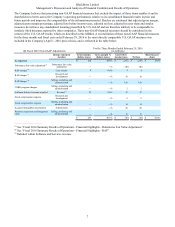
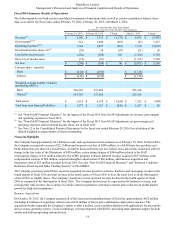
During fiscal 2016, approximately 4.0 million BlackBerry smartphones were sold through to end customers, which included
shipments made and recognized prior to fiscal 2016 and which reduced the Company’s inventory in channel. The number of
BlackBerry smartphones that were sold through to end customers was 8.5 million in fiscal 2015.
The Company’s plan is to achieve profitability in its device business in fiscal 2017.
Service Access Fees Revenue
Service access fees revenue decreased by $827 million, or 51.5%, to $779 million, or 36.1% of revenue, in fiscal 2016,
compared to $1.6 billion, or 48.2% of revenue, in fiscal 2015. The decrease in service access fees revenue, which is generated
from users of BlackBerry 7 and prior BlackBerry operating systems, is primarily attributable to a lower number of BlackBerry
7 users and lower revenue from those users (particularly as those users upgrade to BlackBerry devices that do not generate
service access fees or to a competitor’s device), as well as a continued shift in the mix of the Company’s customers from
higher-tiered unlimited plans to prepaid and lower-tiered plans, compared to fiscal 2015.
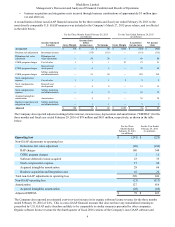
Other Revenue
Other revenue, which includes non-warranty repairs, accessories, and telecommunications revenues of AtHoc, decreased by
$25 million, or 50.0% to $25 million, or 1.2% of revenue in fiscal 2016 compared to $50 million, or 1.5% of revenue in fiscal
2015. The decrease was primarily attributable to a decrease in accessory and non-warranty repair revenues.
Revenue Trends
The Company has seen both its revenue and its smartphone market share decline in recent years relative to companies such as
Apple with its iOS ecosystem, and companies that build smartphones based on the Android ecosystem, such as Samsung and
Lenovo/Motorola.
This decline is due to a variety of factors, including consumer preferences for devices with access to the broadest number of
applications, such as those available in the iOS and Android platforms, and lower average selling prices for the Company’s
devices. Revenue and market share have also been impacted by intense competition, including from the significant number of
new Android based competitors that have emerged, and by the BYOD trend in the enterprise market. Some of the Company’s
competitors have greater name recognition, larger customer bases, and significantly greater financial, technical, marketing,
public relations, sales, distribution and other resources than the Company. In addition, uncertainty relating to the Company’s
strategy and operations may have negatively impacted demand for the Company’s products.
The Company has introduced both software and hardware products to address the shift in the market toward enterprise mobility
solutions that can handle a range of requirements and deployment models. See “Business Overview - Strategy, Products and
Services”.
For further information regarding the Company’s competitors, please see the section in the AIF entitled “Narrative Description
of the Business - Competition”.
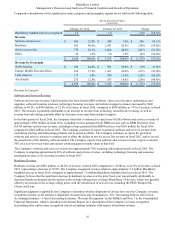
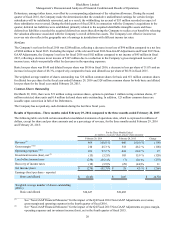
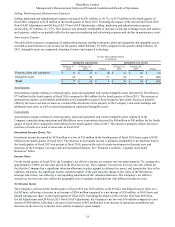
Revenue by Geography
North America Revenues
Revenues in North America were $952 million, or 44.0% of revenue in fiscal 2016, reflecting a decrease of $39 million
compared to $991 million, or 29.6% of revenue in fiscal 2015. The decrease in North American revenue is primarily
attributable to a decrease in revenue from the United States, which represented approximately 33.0% of total revenue in fiscal
2016, compared to 23.2% of total revenue in fiscal 2015. Sales in Canada represented approximately 11.0% of total revenue in
fiscal 2016, compared to 6.4% of total revenue in fiscal 2015.
Revenues in North America have continued to decline due to the Company’s aging product portfolio, decreased hardware
demand and the continued erosion of revenue from service access fees, partially offset by a result of the increased revenue from
technology licensing, acquired companies and sales of the Company’s newest devices.
As a percentage of overall revenue, revenues in North America increased significantly due to increased revenue from
technology licensing and revenue from WatchDox, AtHoc and Good.
Europe, Middle East and Africa Revenues
Revenues in Europe, Middle East and Africa were $816 million, or 37.8% of revenue, in fiscal 2016, reflecting a decrease of
$615 million compared to $1.4 billion, or 43.0% of revenue, in fiscal 2015. The decrease in revenue is due to decreased
hardware demand and the continued erosion of revenues from service access fees, partially offset by revenue associated with
Secusmart and Good, increased revenue from software licensing and Classic, Leap and PRIV device sales.
Some of the larger markets comprising this region include the United Kingdom, Germany and South Africa.