Blackberry 2016 Annual Report Download - page 102
Download and view the complete annual report
Please find page 102 of the 2016 Blackberry annual report below. You can navigate through the pages in the report by either clicking on the pages listed below, or by using the keyword search tool below to find specific information within the annual report.-
 1
1 -
2
-
3
-
4
-
5
-
6
-
7
-
8
-
9
-
10
-
11
-
12
-
13
-
14
-
15
-
16
-
17
-
18
-
19
-
20
-
21
-
22
-
23
-
24
-
25
-
26
-
27
-
28
-
29
-
30
-
31
-
32
-
33
-
34
-
35
-
36
-
37
-
38
-
39
-
40
-
41
-
42
-
43
-
44
-
45
-
46
-
47
-
48
-
49
-
50
-
51
-
52
-
53
-
54
-
55
-
56
-
57
-
58
-
59
-
60
-
61
-
62
-
63
-
64
-
65
-
66
-
67
-
68
-
69
-
70
-
71
-
72
-
73
-
74
-
75
-
76
-
77
-
78
-
79
-
80
-
81
-
82
-
83
-
84
-
85
-
86
-
87
-
88
-
89
-
90
-
91
-
 92
92 -
 93
93 -
 94
94 -
 95
95 -
 96
96 -
 97
97 -
 98
98 -
 99
99 -
 100
100 -
 101
101 -
 102
102 -
 103
103 -
 104
104 -
 105
105 -
 106
106 -
 107
107 -
 108
108 -
 109
109 -
 110
110 -
 111
111 -
 112
112 -
113
-
114
-
115
-
116
-
117
-
118
-
119
-
120
-
121
-
122
-
123
-
124
-
125
-
126
-
127
-
128
-
129
-
130
-
131
-
132
-
133
-
134
-
135
-
136
-
137
-
138
 |
 |

BlackBerry Limited
Notes to the Consolidated Financial Statements
In millions of United States dollars, except share and per share data, and except as otherwise indicated
34
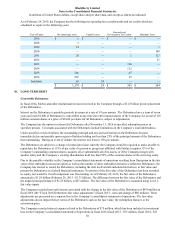
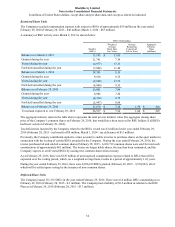
Restricted Share Units
The Company recorded compensation expense with respect to RSUs of approximately $59 million in the year ended
February 29, 2016 (February 28, 2015 - $48 million; March 1, 2014 - $63 million).
A summary of RSU activity since March 2, 2013 is shown below:
RSUs Outstanding
Number
(000’s)
Weighted
Average
Grant Date
Fair Value
Average
Remaining
Contractual
Life in Years
Aggregate
Intrinsic
Value
(millions)
Balance as at March 2, 2013 15,185 $ 13.83
Granted during the year 21,741 7.39
Vested during the year (4,977) 17.11
Forfeited/cancelled during the year (7,604) 11.44
Balance as at March 1, 2014 24,345 8.15
Granted during the year 9,530 9.72
Vested during the year (2,928) 13.73
Forfeited/cancelled during the year (4,946) 9.55
Balance as at February 28, 2015 26,001 7.84
Granted during the year 8,986 7.20
Vested during the year (4,320) 8.75
Forfeited/cancelled during the year (2,997) 8.84
Balance as at February 29, 2016 27,670 $ 7.38 1.79 $ 216
Vested and expected to vest February 29, 2016 26,517 $ 7.36 1.80 $ 207
The aggregate intrinsic value in the table above represents the total pre-tax intrinsic value (the aggregate closing share
price of the Company’s common shares on February 29, 2016, that would have been received by RSU holders if all RSUs
had been vested on February 29, 2016).
Tax deficiencies incurred by the Company related to the RSUs vested was $1 million for the year ended February 29,
2016 (February 28, 2015 - tax benefit of $8 million; March 1, 2014 - tax deficiency of $11 million).
Previously, the Company contributed capital to a trust account to enable a trustee to purchase shares on the open market in
connection with the vesting of certain RSUs awarded by the Company. During the year ended February 29, 2016, the
trustee purchased nil and sold nil common shares (February 28, 2015 - 6,032,719 common shares were sold for total cash
consideration of approximately $61 million). The trustee no longer holds shares, the trust has been terminated, and the
Company expects to settle vested RSUs by issuing new common shares from treasury.
As at February 29, 2016, there was $129 million of unrecognized compensation expense related to RSUs that will be
expensed over the vesting period, which, on a weighted average basis, results in a period of approximately 1.62 years.
During the year ended February 29, 2016, there were 8,986,019 RSUs granted (February 28, 2015 - 9,530,093), all of
which will be settled upon vesting by the issuance of new common shares.
Deferred Share Units
The Company issued 151,335 DSUs in the year ended February 29, 2016. There were 0.4 million DSUs outstanding as at
February 29, 2016 (February 28, 2015 - 0.3 million). The Company had a liability of $3.2 million in relation to the DSU
Plan as at February 29, 2016 (February 28, 2015 - $3.3 million).