Blackberry 2016 Annual Report Download - page 128
Download and view the complete annual report
Please find page 128 of the 2016 Blackberry annual report below. You can navigate through the pages in the report by either clicking on the pages listed below, or by using the keyword search tool below to find specific information within the annual report.-
 1
1 -
2
-
3
-
4
-
5
-
6
-
7
-
8
-
9
-
10
-
11
-
12
-
13
-
14
-
15
-
16
-
17
-
18
-
19
-
20
-
21
-
22
-
23
-
24
-
25
-
26
-
27
-
28
-
29
-
30
-
31
-
32
-
33
-
34
-
35
-
36
-
37
-
38
-
39
-
40
-
41
-
42
-
43
-
44
-
45
-
46
-
47
-
48
-
49
-
50
-
51
-
52
-
53
-
54
-
55
-
56
-
57
-
58
-
59
-
60
-
61
-
62
-
63
-
64
-
65
-
66
-
67
-
68
-
69
-
70
-
71
-
72
-
73
-
74
-
75
-
76
-
77
-
78
-
79
-
80
-
81
-
82
-
83
-
84
-
85
-
86
-
87
-
88
-
89
-
90
-
91
-
92
-
93
-
94
-
95
-
96
-
97
-
98
-
99
-
100
-
101
-
102
-
103
-
104
-
105
-
106
-
107
-
108
-
109
-
110
-
111
-
112
-
113
-
114
-
115
-
116
-
117
-
 118
118 -
 119
119 -
 120
120 -
 121
121 -
 122
122 -
 123
123 -
 124
124 -
 125
125 -
 126
126 -
 127
127 -
 128
128 -
 129
129 -
 130
130 -
 131
131 -
 132
132 -
 133
133 -
 134
134 -
 135
135 -
 136
136 -
 137
137 -
 138
138
 |
 |

BlackBerry Limited
Management’s Discussion and Analysis of Financial Condition and Results of Operations
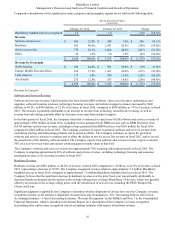
20
Debentures, amongst other items, was offset by a corresponding adjustment of the valuation allowance. During the second
quarter of fiscal 2016, the Company made the determination that the cumulative undistributed earnings for certain foreign
subsidiaries will be indefinitely reinvested, and as a result, the withholding tax accrual of $33 million recorded in respect of
these subsidiaries was reversed. During the third quarter of fiscal 2016, in connection with the Company’s acquisitions in the
quarter, deferred tax liabilities were established, primarily related to the acquired identifiable intangible assets and these
deferred tax liabilities exceeded the acquired deferred tax assets thus allowing the Company to realize a tax benefit by releasing
the valuation allowance associated with the Company’s overall deferred tax assets. The Company’s net effective income tax
recovery rate also reflects the geographic mix of earnings in jurisdictions with different income tax rates.
Net Loss
The Company’s net loss for fiscal 2016 was $208 million, reflecting a decrease in net loss of $96 million compared to a net loss
of $304 million in fiscal 2015. Excluding the impact of the relevant Fiscal 2016 Non-GAAP Adjustments and Fiscal 2015 Non-
GAAP Adjustments, the Company’s net loss for fiscal 2016 was $102 million compared to net income of $45 million in fiscal
2015, reflecting a decrease in net income of $147 million due to a reduction in the Company’s gross margin and recovery of
income taxes, which was partially offset by decreases in the operating expenses.
Basic loss per share was $0.40 and diluted loss per share was $0.86 in fiscal 2016, a decrease in loss per share of 31.0% and an
increase in loss per share of 48.3%, respectively, compared to basic and diluted loss per share of $0.58 in fiscal 2015.
The weighted average number of shares outstanding was 526 million common shares for basic and 651 million common shares
for diluted loss per share for the fiscal year ended February 29, 2016 and 528 million common shares for both basic and diluted
loss per share for the fiscal year ended February 28, 2015.
Common Shares Outstanding
On March 29, 2016, there were 521 million voting common shares, options to purchase 1 million voting common shares, 27
million restricted share units and 0.4 million deferred share units outstanding. In addition, 125 million common shares are
issuable upon conversion in full of the Debentures.
The Company has not paid any cash dividends during the last three fiscal years.
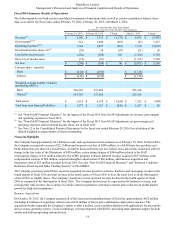
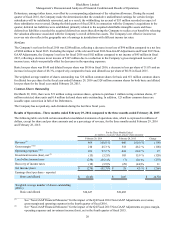
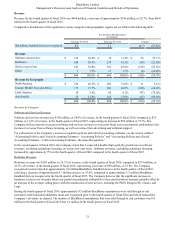
Results of Operations - Three months ended February 29, 2016 compared to the three months ended February 28, 2015
The following table sets forth certain unaudited consolidated statements of operations data, which is expressed in millions of
dollars, except for share and per share amounts and as a percentage of revenue, for the three months ended February 29, 2016
and February 28, 2015:
For the Three Months Ended
(in millions, except for share and per share amounts)
February 29, 2016 February 28, 2015 Change
Revenue(1) 464 100.0 % 660 100.0 % (196)
Gross margin (1)(2) 210 45.3 % 318 48.2 % (108)
Operating expenses (1)(2) 451 97.2 % 424 64.2 % 27
Investment income (loss), net (2) (15) (3.2)% 105 15.9 % (120)
Loss before income taxes (256) (55.1)% (1) (0.1)% (255)
Recovery of income taxes (18) (3.9)% (29) (4.4)% 11
Net income (loss) $(238) (51.3)% $ 28 4.3 % $ (266)
Earnings (loss) per share - reported
Basic and diluted $(0.45) $ 0.05 $ (0.50)
Weighted-average number of shares outstanding
(000’s)
Basic and diluted 524,627 528,685
_________________________
(1) See “Non-GAAP Financial Measures” for the impact of the Q4 Fiscal 2016 Non-GAAP Adjustments on revenue,
gross margin and operating expenses in the fourth quarter of fiscal 2016.
(2) See “Non-GAAP Financial Measures” for the impact of the Q4 Fiscal 2015 Non-GAAP Adjustments on gross margin,
operating expenses and investment income (loss), net in the fourth quarter of fiscal 2015.