Blackberry 2016 Annual Report Download - page 135
Download and view the complete annual report
Please find page 135 of the 2016 Blackberry annual report below. You can navigate through the pages in the report by either clicking on the pages listed below, or by using the keyword search tool below to find specific information within the annual report.-
 1
1 -
2
-
3
-
4
-
5
-
6
-
7
-
8
-
9
-
10
-
11
-
12
-
13
-
14
-
15
-
16
-
17
-
18
-
19
-
20
-
21
-
22
-
23
-
24
-
25
-
26
-
27
-
28
-
29
-
30
-
31
-
32
-
33
-
34
-
35
-
36
-
37
-
38
-
39
-
40
-
41
-
42
-
43
-
44
-
45
-
46
-
47
-
48
-
49
-
50
-
51
-
52
-
53
-
54
-
55
-
56
-
57
-
58
-
59
-
60
-
61
-
62
-
63
-
64
-
65
-
66
-
67
-
68
-
69
-
70
-
71
-
72
-
73
-
74
-
75
-
76
-
77
-
78
-
79
-
80
-
81
-
82
-
83
-
84
-
85
-
86
-
87
-
88
-
89
-
90
-
91
-
92
-
93
-
94
-
95
-
96
-
97
-
98
-
99
-
100
-
101
-
102
-
103
-
104
-
105
-
106
-
107
-
108
-
109
-
110
-
111
-
112
-
113
-
114
-
115
-
116
-
117
-
118
-
119
-
120
-
121
-
122
-
123
-
124
-
 125
125 -
 126
126 -
 127
127 -
 128
128 -
 129
129 -
 130
130 -
 131
131 -
 132
132 -
 133
133 -
 134
134 -
 135
135 -
 136
136 -
 137
137 -
 138
138
 |
 |
BlackBerry Limited
Management’s Discussion and Analysis of Financial Condition and Results of Operations
27
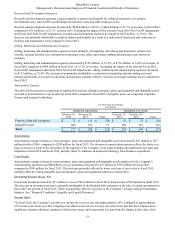
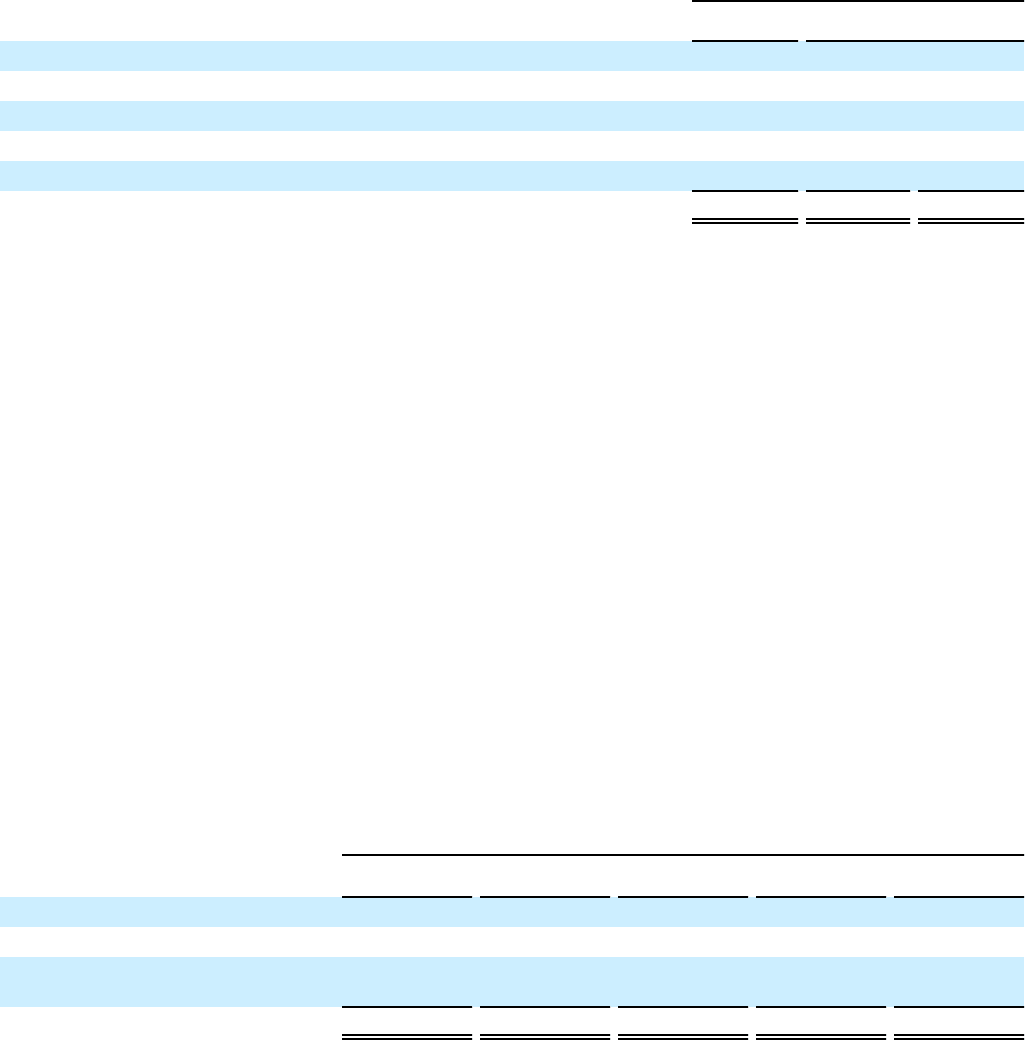
Cash flows for the fiscal year ended February 29, 2016 compared to the fiscal year ended February 28, 2015 were as follows:
For the Fiscal Years Ended
(in millions)
February 29,
2016 February 28,
2015 Change
Net cash flows provided by (used in):
Operating activities $ 257 $ 813 $ (556)
Investing activities (439)(1,173) 734
Financing activities (78) 16 (94)
Effect of foreign exchange loss on cash and cash equivalents (16)(2)(14)
Net increase (decrease) in cash and cash equivalents $(276) $ (346) $ 70
Operating Activities
The decrease in net cash flows provided by operating activities of $556 million primarily reflects the Company’s lower amount
of net income after adjustments for non-cash items, offset by net changes in working capital.
Investing Activities
During the fiscal year ended February 29, 2016, cash flows used in investing activities were $439 million and included cash
flows used in business acquisitions of $698 million, intangible asset additions of $70 million, acquisitions of property, plant and
equipment of $32 million, offset by proceeds on sale or maturity of short-term investments and long-term investments, net of
the costs of acquisitions, in the amount of $357 million. For the same period of the prior fiscal year, cash flows used in
investing activities were $1.2 billion and included cash flows used in transactions involving the proceeds on sale or maturity of
short-term investments and long-term investments, net of the costs of acquisitions, in the amount of $894 million, intangible
asset additions of $421 million, business acquisitions of $119 million, acquisitions of property, plant and equipment of $87
million, offset by proceeds on the sale of property, plant and equipment of $344 million.
During the fiscal year ended February 29, 2016, the cash flows used in business acquisitions related to the Good, AtHoc,
WatchDox and Encription acquisitions.
Financing Activities
The decrease in cash flows provided by financing activities was $94 million for fiscal 2016 and was primarily attributable to
the cash used in the Repurchase Program, partially offset by the release of restricted cash.
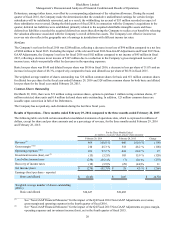
Aggregate Contractual Obligations
The following table sets out aggregate information about the Company’s contractual obligations and the periods in which
payments are due as at February 29, 2016:
(in millions)
Total Less than One
Year One to
Three Years Four to Five
Years Greater than
Five Years
Operating lease obligations $ 116 $ 37 $ 51 $ 21 $ 7
Purchase obligations and commitments 391 371 20 — —
Long-term debt interest and principal
payments 353 75 150 128 —
Total $ 860 $ 483 $ 221 $ 149 $ 7
Aggregate contractual obligations amounted to approximately $860 million as at February 29, 2016, including purchase orders
with contract manufacturers in the amount of $162 million. The Company also has commitments on account of capital
expenditures of approximately $2 million included in this total, primarily for manufacturing and information technology,
including service operations. The remaining balance consists of purchase orders or contracts with suppliers of raw materials, as
well as other goods and services utilized in the operations of the Company, including payments on account of licensing
agreements. Total aggregate contractual obligations as at February 29, 2016 decreased by $444 million as compared to the
February 28, 2015 balance of approximately $1.3 billion, which was primarily attributable to a decrease in purchase orders with
contract manufacturers and payments on account of licensing agreements, as well as a decrease in interest payments on the
Debentures, and operating lease commitments.