Blackberry 2016 Annual Report Download - page 81
Download and view the complete annual report
Please find page 81 of the 2016 Blackberry annual report below. You can navigate through the pages in the report by either clicking on the pages listed below, or by using the keyword search tool below to find specific information within the annual report.-
 1
1 -
2
-
3
-
4
-
5
-
6
-
7
-
8
-
9
-
10
-
11
-
12
-
13
-
14
-
15
-
16
-
17
-
18
-
19
-
20
-
21
-
22
-
23
-
24
-
25
-
26
-
27
-
28
-
29
-
30
-
31
-
32
-
33
-
34
-
35
-
36
-
37
-
38
-
39
-
40
-
41
-
42
-
43
-
44
-
45
-
46
-
47
-
48
-
49
-
50
-
51
-
52
-
53
-
54
-
55
-
56
-
57
-
58
-
59
-
60
-
61
-
62
-
63
-
64
-
65
-
66
-
67
-
68
-
69
-
70
-
 71
71 -
 72
72 -
 73
73 -
 74
74 -
 75
75 -
 76
76 -
 77
77 -
 78
78 -
 79
79 -
 80
80 -
 81
81 -
 82
82 -
 83
83 -
 84
84 -
 85
85 -
 86
86 -
 87
87 -
 88
88 -
 89
89 -
 90
90 -
 91
91 -
92
-
93
-
94
-
95
-
96
-
97
-
98
-
99
-
100
-
101
-
102
-
103
-
104
-
105
-
106
-
107
-
108
-
109
-
110
-
111
-
112
-
113
-
114
-
115
-
116
-
117
-
118
-
119
-
120
-
121
-
122
-
123
-
124
-
125
-
126
-
127
-
128
-
129
-
130
-
131
-
132
-
133
-
134
-
135
-
136
-
137
-
138
 |
 |

BlackBerry Limited
Notes to the Consolidated Financial Statements
In millions of United States dollars, except share and per share data, and except as otherwise indicated
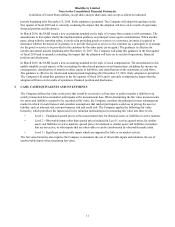
13
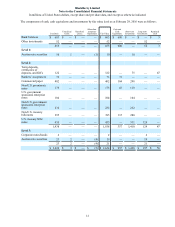
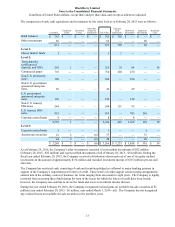
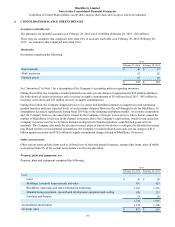
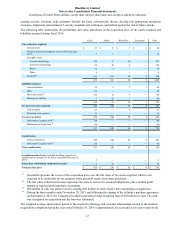
The components of cash, cash equivalents and investments by fair value level as at February 28, 2015 were as follows:
Cost Basis Unrealized
Gains Unrealized
Losses
Other-than-
temporary
Impairment Fair Value
Cash and
Cash
Equivalents Short-term
Investments Long-term
Investments Restricted
Cash
Bank balances $ 765 $ — $ — $ — $ 765 $ 765 $ — $ — $ —
Other investments 66———66——66—
831 — — — 831 765 — 66 —
Level 1:
Money market funds 1——— 1 1———
Level 2:
Term deposits,
certificates of
deposits, and GICs 218 1 — — 219 76 84 — 59
Commercial paper 710 — — — 710 240 470 — —
Non-U.S. promissory
notes 100 — — — 100 — 100 — —
Non-U.S. government
sponsored enterprise
notes 49———49—49——
U.S. government
sponsored enterprise
notes 149 — — — 149 — 149 — —
Non-U.S. treasury
bills/notes 244 — — — 244 151 93 — —
U.S. treasury bills/
notes 915 — — — 915 — 705 210 —
Corporate notes/bonds 8 — — — 8 — 8 — —
2,393 1 — — 2,394 467 1,658 210 59
Level 3:
Corporate notes/bonds 3——— 3—— 3—
Auction rate securities 41 2 — (6) 37 — — 37 —
44 2 — (6) 40 — — 40 —
$ 3,269 $ 3 $ — $ (6) $ 3,266 $ 1,233 $ 1,658 $ 316 $ 59
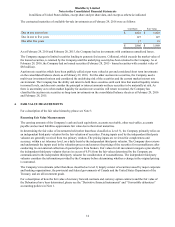
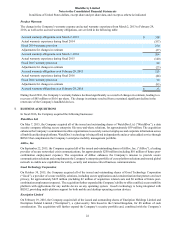
As at February 29, 2016, the Company’s other investments consisted of cost method investments of $52 million
(February 28, 2015 - $52 million) and equity method investments of nil (February 28, 2015 - $14 million). During the
fiscal year ended February 28, 2015, the Company received a distribution of proceeds out of one of its equity method
investments in the amount of approximately $134 million and recorded investment income of $115 million (pre-tax and
after-tax).
The Company has restricted cash, consisting of cash and securities pledged as collateral to major banking partners in
support of the Company’s requirements for letters of credit. These letters of credit support certain leasing arrangements
entered into in the ordinary course of business, for terms ranging from one month to eight years. The Company is legally
restricted from accessing these funds during the term of the leases for which the letters of credit have been issued;
however, the Company can continue to invest the funds and receive investment income thereon.
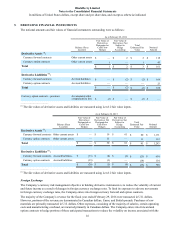
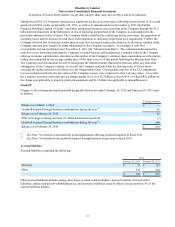
During the year ended February 29, 2016, the Company recognized realized gains on available-for-sale securities of $1
million (year ended February 28, 2015 - $6 million, year ended March 1, 2014 - nil). The Company has not recognized
any realized losses on available-for-sale securities in the last three years.