Blackberry 2016 Annual Report Download - page 86
Download and view the complete annual report
Please find page 86 of the 2016 Blackberry annual report below. You can navigate through the pages in the report by either clicking on the pages listed below, or by using the keyword search tool below to find specific information within the annual report.-
 1
1 -
2
-
3
-
4
-
5
-
6
-
7
-
8
-
9
-
10
-
11
-
12
-
13
-
14
-
15
-
16
-
17
-
18
-
19
-
20
-
21
-
22
-
23
-
24
-
25
-
26
-
27
-
28
-
29
-
30
-
31
-
32
-
33
-
34
-
35
-
36
-
37
-
38
-
39
-
40
-
41
-
42
-
43
-
44
-
45
-
46
-
47
-
48
-
49
-
50
-
51
-
52
-
53
-
54
-
55
-
56
-
57
-
58
-
59
-
60
-
61
-
62
-
63
-
64
-
65
-
66
-
67
-
68
-
69
-
70
-
71
-
72
-
73
-
74
-
75
-
 76
76 -
 77
77 -
 78
78 -
 79
79 -
 80
80 -
 81
81 -
 82
82 -
 83
83 -
 84
84 -
 85
85 -
 86
86 -
 87
87 -
 88
88 -
 89
89 -
 90
90 -
 91
91 -
 92
92 -
 93
93 -
 94
94 -
 95
95 -
 96
96 -
97
-
98
-
99
-
100
-
101
-
102
-
103
-
104
-
105
-
106
-
107
-
108
-
109
-
110
-
111
-
112
-
113
-
114
-
115
-
116
-
117
-
118
-
119
-
120
-
121
-
122
-
123
-
124
-
125
-
126
-
127
-
128
-
129
-
130
-
131
-
132
-
133
-
134
-
135
-
136
-
137
-
138
 |
 |

BlackBerry Limited
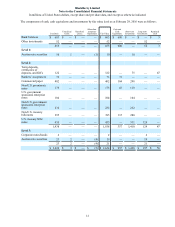
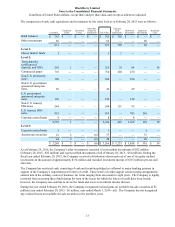
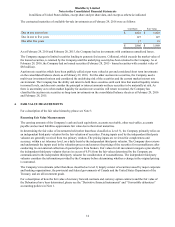
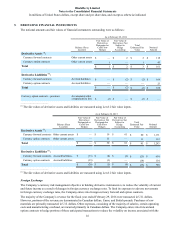
Notes to the Consolidated Financial Statements
In millions of United States dollars, except share and per share data, and except as otherwise indicated
18
paid) of nil were recorded in respect of these instruments (February 28, 2015 - net unrealized gains of $57 million).
Unrealized gains associated with these contracts were recorded in other current assets and selling, marketing and
administration expenses. Unrealized losses were recorded in accrued liabilities and selling, marketing and administration
expenses.
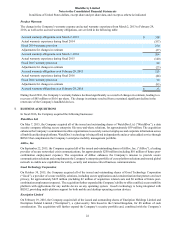
The following table shows the impact of derivative instruments that are not subject to hedge accounting on the
consolidated statements of operations for the years ended February 29, 2016 and February 28, 2015:
Amount of Gain (Loss) in
Income on Derivative Instruments
Location of Gain (Loss) Recognized in
Income on Derivative Instruments February 29, 2016 February 28, 2015
Currency forward contracts Selling, marketing and administration $ 44 $ 156
Currency option contracts Selling, marketing and administration (4) 11
Total $ 40 $ 167
For information concerning the impact of foreign exchange on the consolidated statement of operations net of the above
derivative instruments, please see Note 16.
Credit Risk
The Company is exposed to credit risk on derivative financial instruments arising from the potential for counterparties to
default on their contractual obligations. The Company mitigates this risk by limiting counterparties to highly rated
financial institutions and by continuously monitoring their creditworthiness. The Company’s exposure to credit loss and
market risk will vary over time as a function of currency exchange rates. The Company measures its counterparty credit
exposure as a percentage of the total fair value of the applicable derivative instruments. Where the net fair value of
derivative instruments with any counterparty is negative, the Company deems the credit exposure to that counterparty to
be nil. As at February 29, 2016, the maximum credit exposure to a single counterparty, measured as a percentage of the
total fair value of derivative instruments with net unrealized gains, was 82% (February 28, 2015 - 47%; March 1, 2014 -
100%). As at February 29, 2016, the Company had a total credit risk exposure across all counterparties with outstanding
or unsettled foreign exchange derivative instruments of $1 million on a notional value of $291 million (February 28, 2015
- $56 million total credit risk exposure on a notional value of $2.1 billion).
The Company maintains Credit Support Annexes (“CSAs”) with several of its counterparties. These CSAs require the
outstanding net position of all contracts be made whole by the paying or receiving of collateral to or from the
counterparties on a daily basis, subject to exposure and transfer thresholds. As at February 29, 2016, the Company had
posted $2 million of collateral to counterparties (February 28, 2015 - collateral held of $15 million), which approximated
the fair value of those contracts. As with the derivatives recorded in an unrealized loss position, this amount is recorded in
accrued liabilities.
The Company is exposed to market and credit risk on its investment portfolio. The Company reduces this risk by
investing in liquid, investment grade securities and by limiting exposure to any one entity or group of related entities. As
at February 29, 2016, the maximum exposure to a single entity was approximately 17% of the total cash, cash equivalents
and investments (February 28, 2015 - maximum exposure of approximately 28%), and that entity was the United States
Department of the Treasury.
Interest Rate Risk
Cash and cash equivalents and investments are invested in certain instruments of varying maturities. Consequently, the
Company is exposed to interest rate risk as a result of holding investments of varying maturities. The fair value of
investments, as well as the investment income derived from the investment portfolio, will fluctuate with changes in
prevailing interest rates. The Company has also issued the Debentures with a fixed interest rate. The fair value of the
Debentures will fluctuate with changes in prevailing interest rates. Consequently, the Company is exposed to interest rate
risk as a result of the long term of the Debentures. The Company does not currently utilize interest rate derivative
instruments to hedge its investment portfolio.