Blackberry 2016 Annual Report Download - page 134
Download and view the complete annual report
Please find page 134 of the 2016 Blackberry annual report below. You can navigate through the pages in the report by either clicking on the pages listed below, or by using the keyword search tool below to find specific information within the annual report.-
 1
1 -
2
-
3
-
4
-
5
-
6
-
7
-
8
-
9
-
10
-
11
-
12
-
13
-
14
-
15
-
16
-
17
-
18
-
19
-
20
-
21
-
22
-
23
-
24
-
25
-
26
-
27
-
28
-
29
-
30
-
31
-
32
-
33
-
34
-
35
-
36
-
37
-
38
-
39
-
40
-
41
-
42
-
43
-
44
-
45
-
46
-
47
-
48
-
49
-
50
-
51
-
52
-
53
-
54
-
55
-
56
-
57
-
58
-
59
-
60
-
61
-
62
-
63
-
64
-
65
-
66
-
67
-
68
-
69
-
70
-
71
-
72
-
73
-
74
-
75
-
76
-
77
-
78
-
79
-
80
-
81
-
82
-
83
-
84
-
85
-
86
-
87
-
88
-
89
-
90
-
91
-
92
-
93
-
94
-
95
-
96
-
97
-
98
-
99
-
100
-
101
-
102
-
103
-
104
-
105
-
106
-
107
-
108
-
109
-
110
-
111
-
112
-
113
-
114
-
115
-
116
-
117
-
118
-
119
-
120
-
121
-
122
-
123
-
 124
124 -
 125
125 -
 126
126 -
 127
127 -
 128
128 -
 129
129 -
 130
130 -
 131
131 -
 132
132 -
 133
133 -
 134
134 -
 135
135 -
 136
136 -
 137
137 -
 138
138
 |
 |

BlackBerry Limited
Management’s Discussion and Analysis of Financial Condition and Results of Operations
26
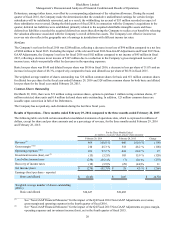
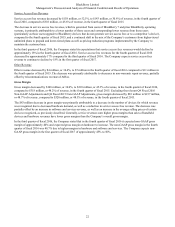
A comparative summary of cash, cash equivalents, and investments is set out below:
As at
(in millions)
February 29, 2016 February 28, 2015 Change
Cash and cash equivalents $ 957 $ 1,233 $ (276)
Restricted cash 50 59 (9)
Short-term investments 1,420 1,658 (238)
Long-term investments 197 316 (119)
Cash, cash equivalents, and investments $ 2,624 $ 3,266 $ (642)
The table below summarizes the current assets, current liabilities, and working capital of the Company:
As at
(in millions)
February 29, 2016 February 28, 2015 Change
Current assets $ 3,011 $ 4,167 $ (1,156)
Current liabilities 1,039 1,372 (333)
Working capital $ 1,972 $ 2,795 $ (823)
Current Assets
The decrease in current assets of $1,156 million at the end of fiscal 2016 from the end of fiscal 2015 was primarily due to
decreases in cash and cash equivalents of $276 million, other current assets of $273 million, short term investments of $238
million, income taxes receivable of $169 million, and accounts receivable of $165 million.
At February 29, 2016, accounts receivable was $338 million, a decrease of $165 million from February 28, 2015. The decrease
reflects the lower revenues recognized during fiscal 2016, as well as a decrease in days sales outstanding to approximately 68
days in the fourth quarter of fiscal 2016 from approximately 69 days at the end of fiscal 2015.
At February 29, 2016, income taxes receivable was nil, a decrease of $169 million from February 28, 2015. The decrease in
income taxes receivable was primarily due to the receipt of the Company’s 2015 Canadian income tax refund.
At February 29, 2016, other current assets was $102 million, a decrease of $273 million from February 28, 2015. The decrease
in other current assets was due to the recognition of previously deferred cost of goods sold, upon recognition of the related
deferred revenue and by a decrease in the fair value of derivative instruments.
At February 29, 2016, inventories increased by $21 million to $143 million compared to $122 million as at February 28, 2015,
due to increases in raw materials and finished goods, offset by a decrease in work in process.
Current Liabilities
The decrease in current liabilities of $333 million at the end of fiscal 2016 from the end of fiscal 2015 was primarily due to
decreases in accrued liabilities and deferred revenue. As at February 29, 2016, accrued liabilities were $368 million, reflecting
a decrease of $299 million compared to February 28, 2015, which was primarily attributable to decreases in vendor liabilities,
warranty liabilities and accrued incentive payments compared to the fourth quarter of fiscal 2015. Accounts payable was $270
million as at February 29, 2016, reflecting an increase of $35 million from February 28, 2015, which was primarily attributable
to amounts owing for the manufacturing of devices. Deferred revenue was $392 million, which reflects a decrease of $78
million compared to February 28, 2015 due to an increase in the volume of transactions that met the criteria for recognition of
revenue as at February 29, 2016.